01Why this exists
Monthly close: the team has two numbers for everything — what MSCI says, and what Backstop says. They don't match. Some differences are noise (rounding to one decimal on a $1B portfolio is ±$50K per row), some are real (a manager booked a redemption on the 30th but the PDF was generated on the 28th), some are bugs (a feeder fund was rolled up on one side but not the other).
Before this dashboard the workflow was a 200-row Excel with a "comments" column. People forgot which rows they'd checked, two reviewers signed off the same row independently with conflicting notes, and stale sign-offs from the previous month carried over silently when the new MSCI export landed.
02Data sources & pipeline
| Side | Source | Pulls |
|---|---|---|
| System A (left) | MSCI Performance Overview Export | xlsx — market value, MTD/YTD/FYTD/1Y/3Y returns, hierarchy via indent levels |
| System B (right) | Backstop Performance Report | PDF — same metrics, parsed with pdfplumber |
| Sign-off state | signoffs.js | Shared file on the team drive (one JS object keyed by ac/sub/manager) |
The Python build script walks both sources, normalises asset-class names (so "Credit & Fixed Income" on one side matches "Fixed Income" on the other), flattens the four-level Excel hierarchy down to the three the PDF uses, and joins each row with fuzzy matching. Special cases handled: rollup feeders (one MSCI row vs. multiple Backstop rows or vice versa), unmatched rows on either side, and benchmark-only rows.
Per row the dashboard computes a delta and an effective delta — the effective delta accounts for the PDF's 1-decimal rounding precision (returns within ±5 bps, market value within ±$50K per row are treated as equal). The severity tier (OK Warn Alert Missing) is then assigned by metric-specific thresholds you can tune in the UI.
03Salient features
Hierarchical view
Asset Class → Sub-class → Manager. Expand-to-sub or expand-all buttons let you zoom in on just one segment or see everything.
Severity tinting
Every cell is coloured by how far out of tolerance its delta is. OK rows stay white; Warn rows tint amber; Alert rows tint red; one-sided rows show as Missing.
Sign-off workflow
Click a manager → detail panel opens → you see side-by-side values, leave a note, assign an owner, click "Sign off". State is timestamped and saved.
Likely-cause hints
For each unresolved row the engine generates plain-English hypotheses: "MV differs but returns match — likely a valuation timing or FX or cash treatment difference." Six rule families cover the common cases.
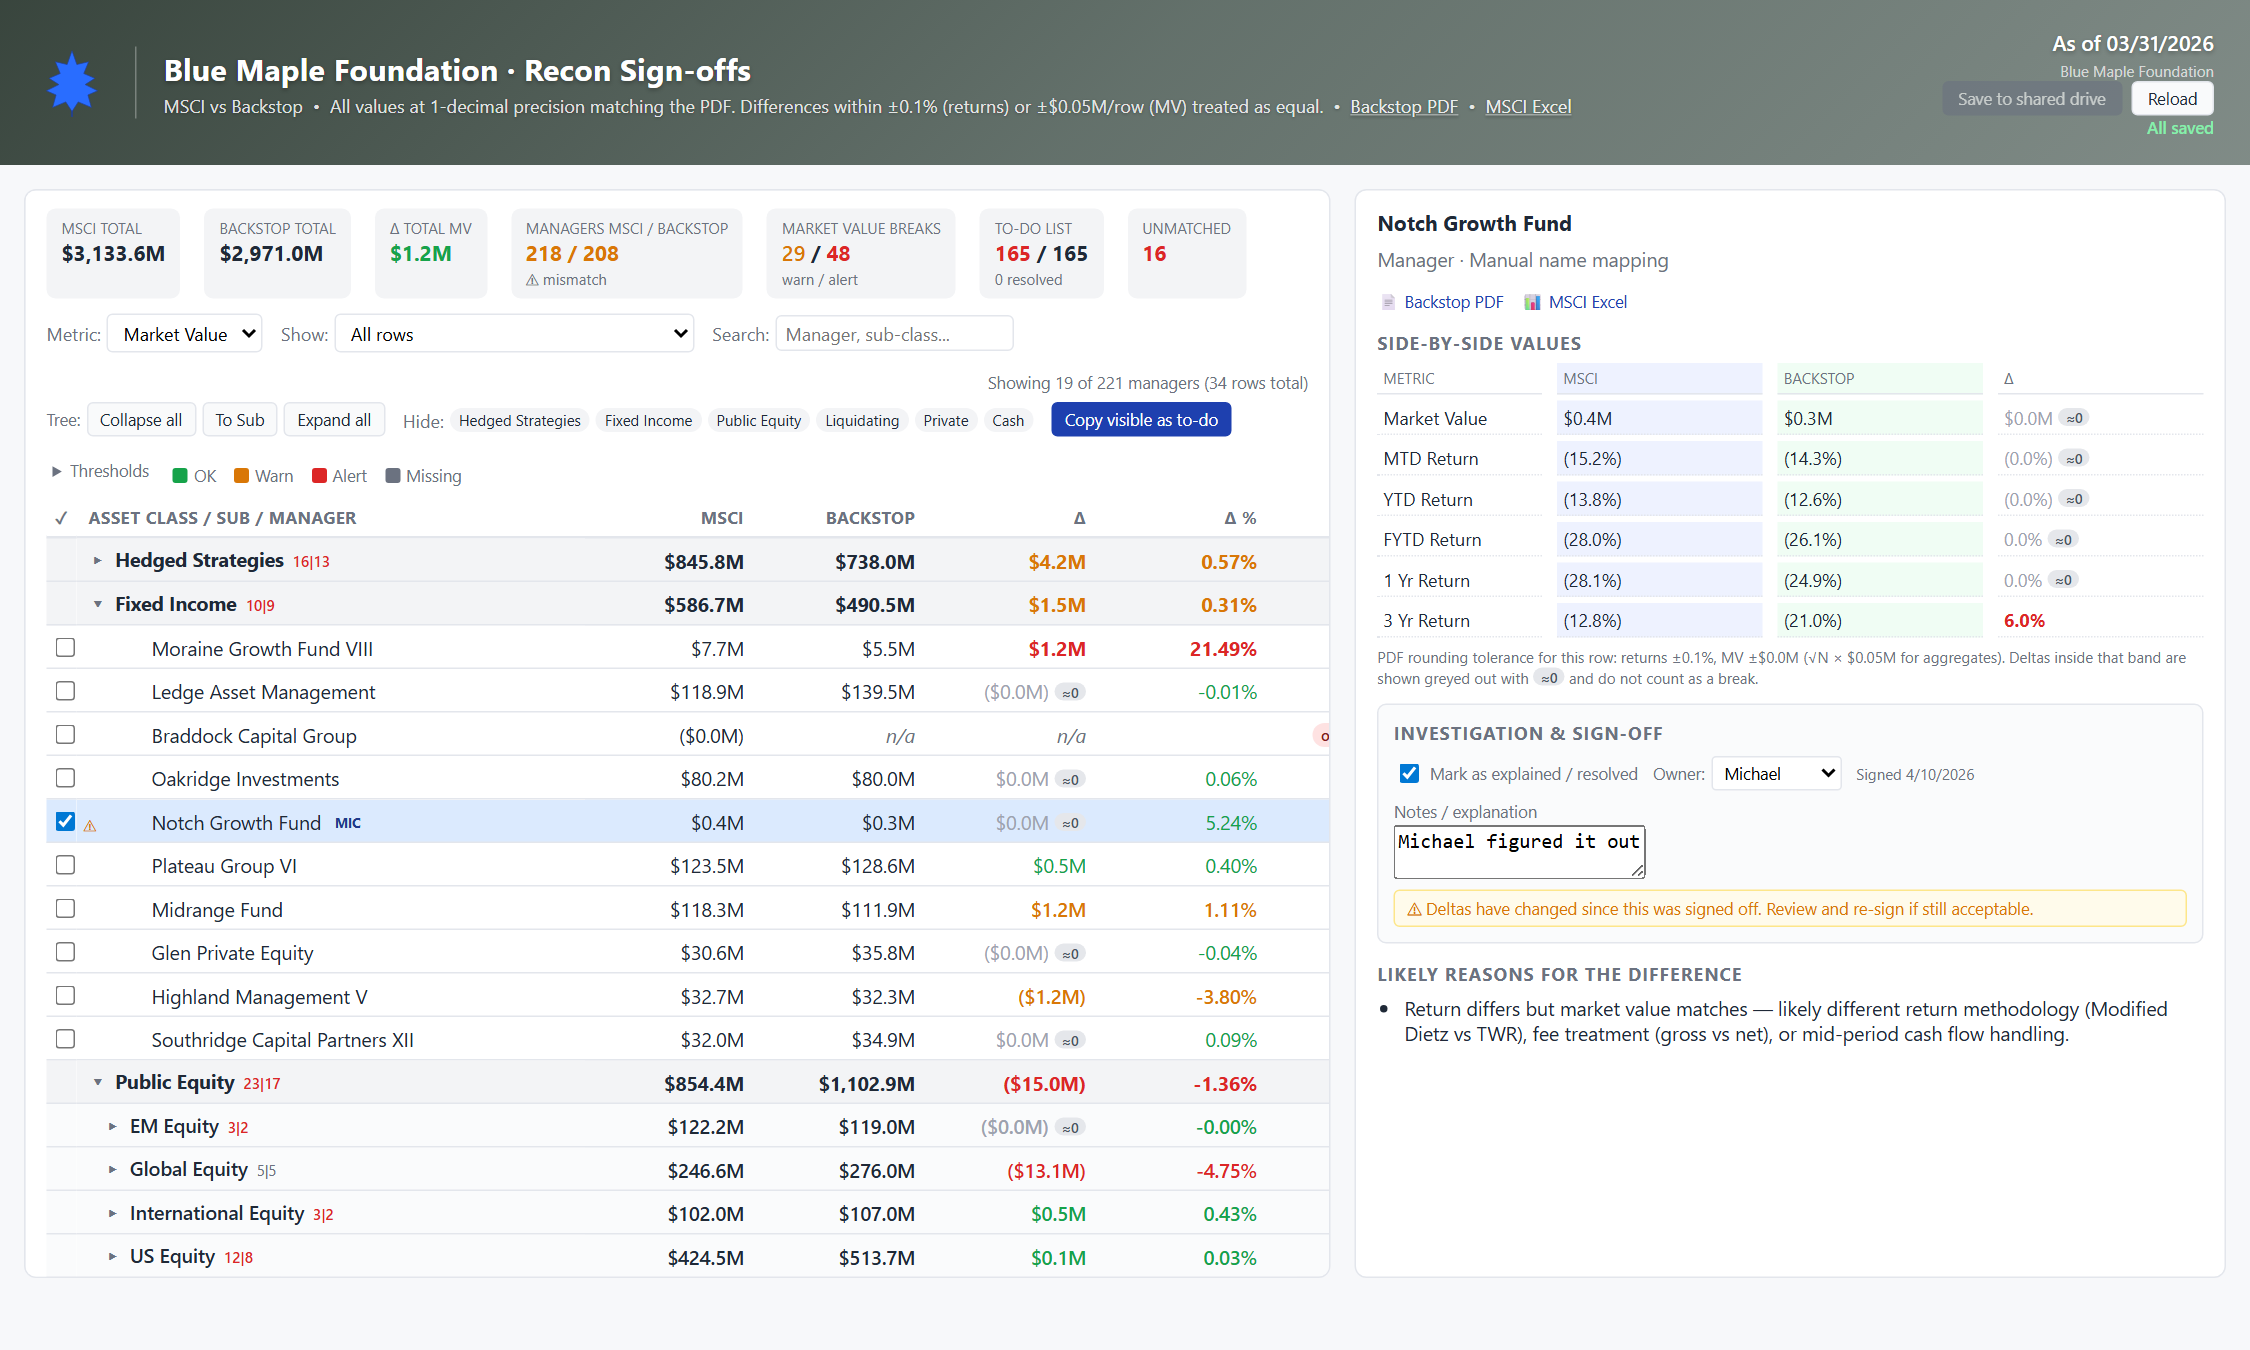
Stale-signoff detection
When the source data changes after you signed off, the row is flagged as stale until you re-validate. Prevents last month's approval from carrying forward silently.
Tunable thresholds
MV warn/alert, MV-relative warn/alert, and return warn/alert thresholds are all user-configurable and persist in localStorage.
Multi-filter
Drop-down: all rows / only warn-or-alert / only alerts / any metric out of tolerance / only unresolved / only one-sided. Plus a free-text search for manager names.
Shared file persistence
Sign-offs save back to signoffs.js on the team drive. Anyone who opens the dashboard sees the latest state. Reviewer A's sign-off appears on Reviewer B's screen on next refresh.
04How to use it
Demo URL: signoffs.html. In the live version sign-offs persist to a shared file; in this demo they persist to your browser's localStorage.
Open the dashboard and orient yourself
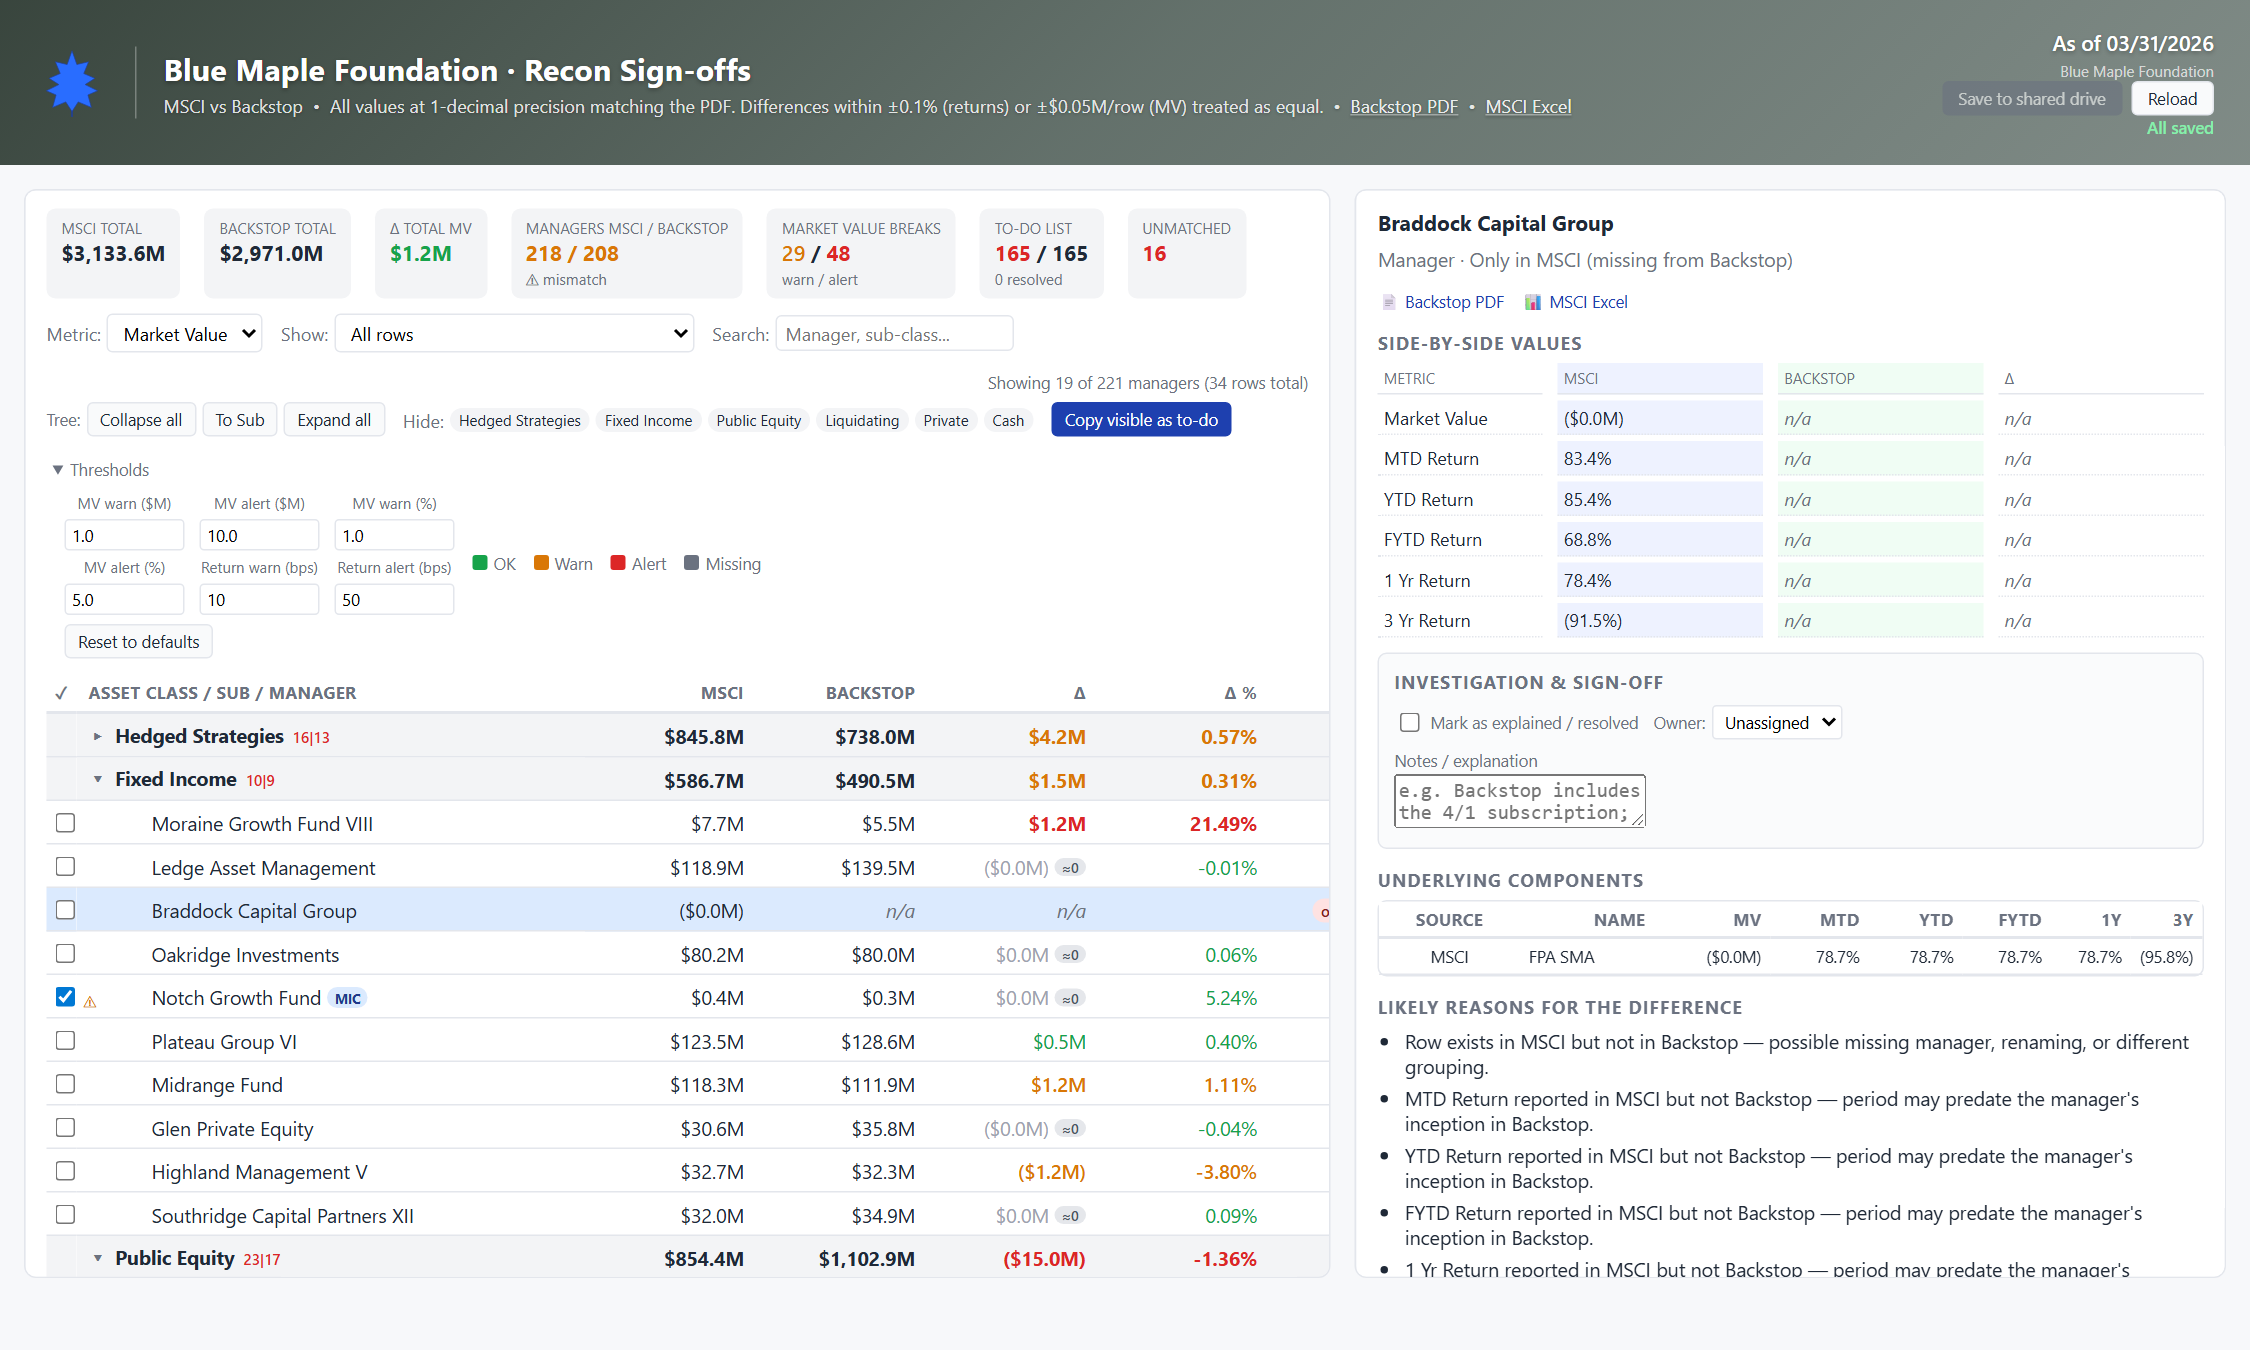
Top bar shows the period (As of MM/DD/YYYY) and the source labels — "Backstop PDF" vs "MSCI Excel". The toolbar below has a metric switcher (Market Value / MTD / YTD / FYTD / 1Y / 3Y), a filter dropdown, a search box, and the threshold settings.
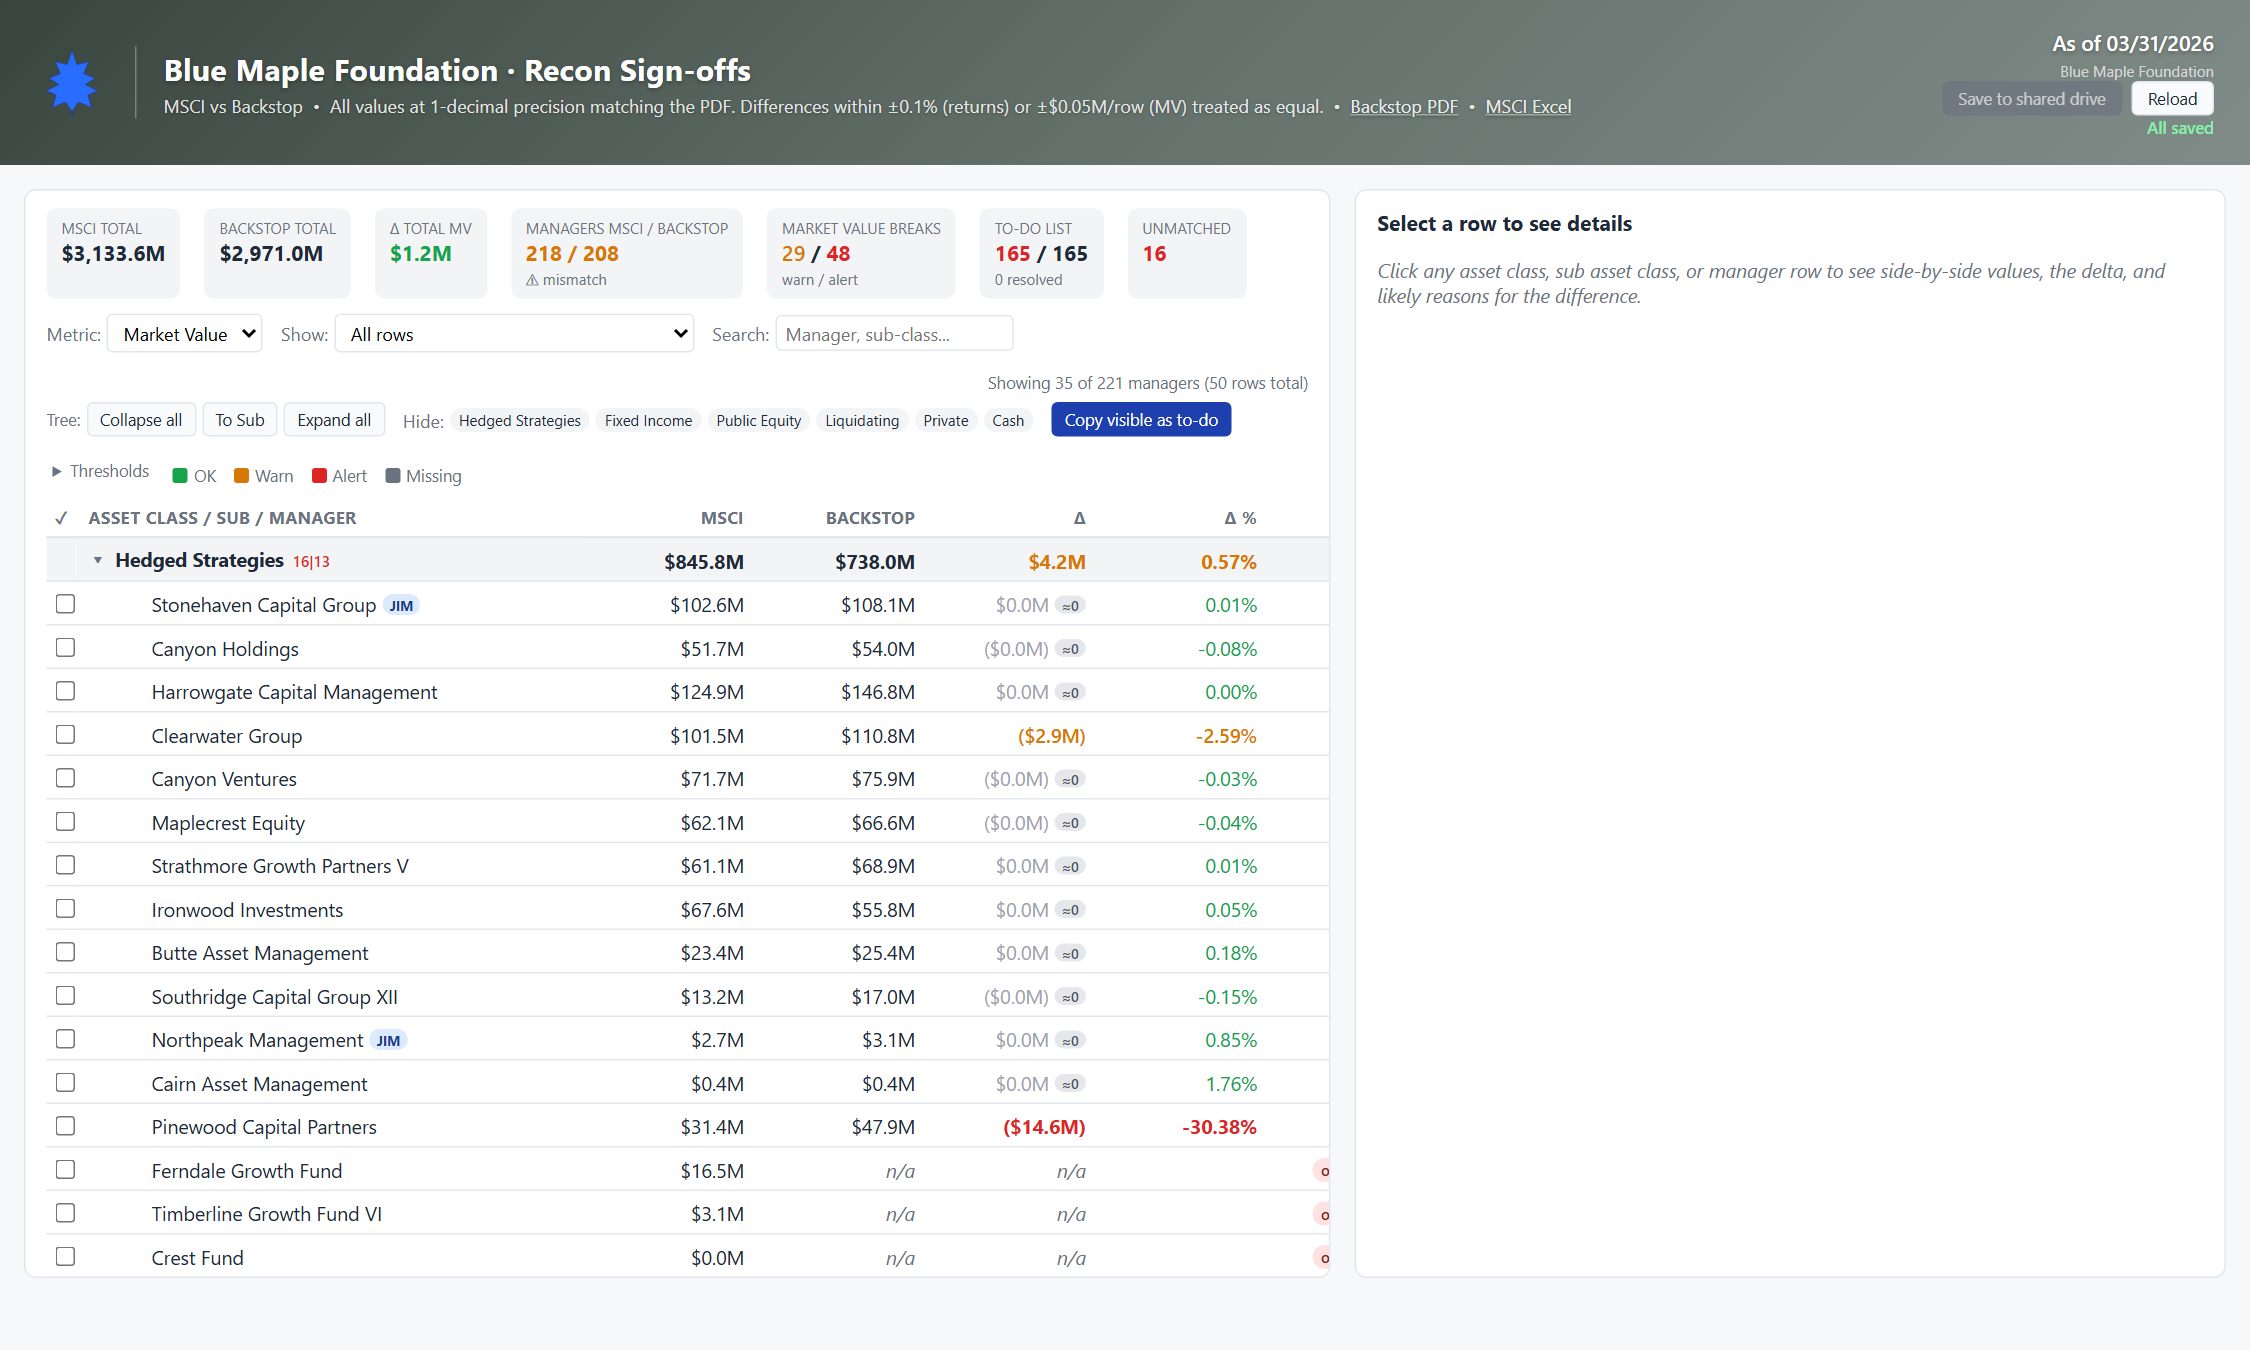
Read the row layout
Each row shows: a checkbox (sign-off state), the manager name with its asset-class crumb, MSCI value, Backstop value, raw delta, percent delta, and the match-type chip (direct / rollup / split / unmatched). Cell tint shows severity at a glance.
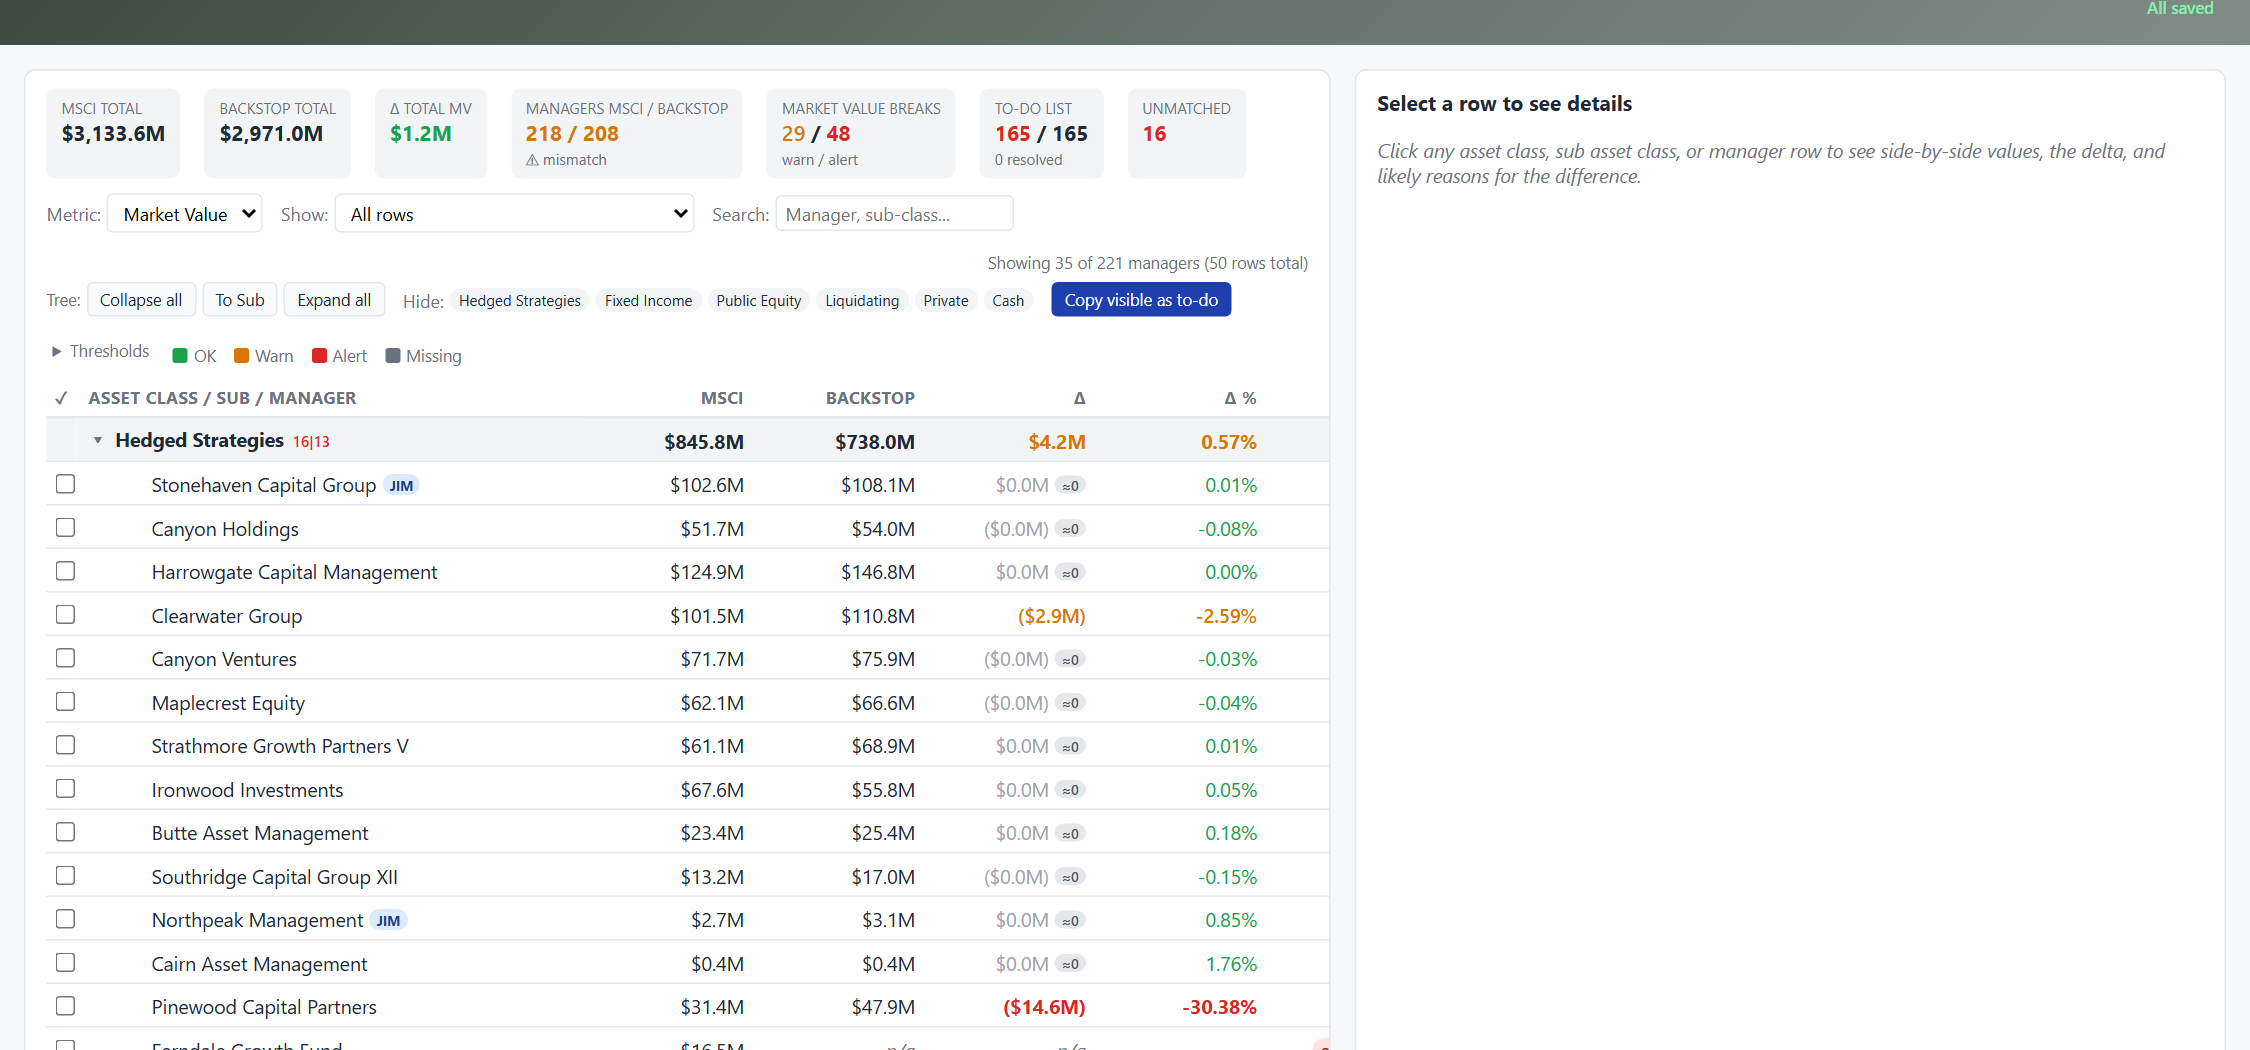
Filter to only what needs attention
Open the Filter dropdown and pick "Only unresolved" to hide rows already signed off. Or pick "Any metric out of tolerance" to surface rows where any of the six metrics (not just the current one) is flagged. Combine with the search box to scope further.
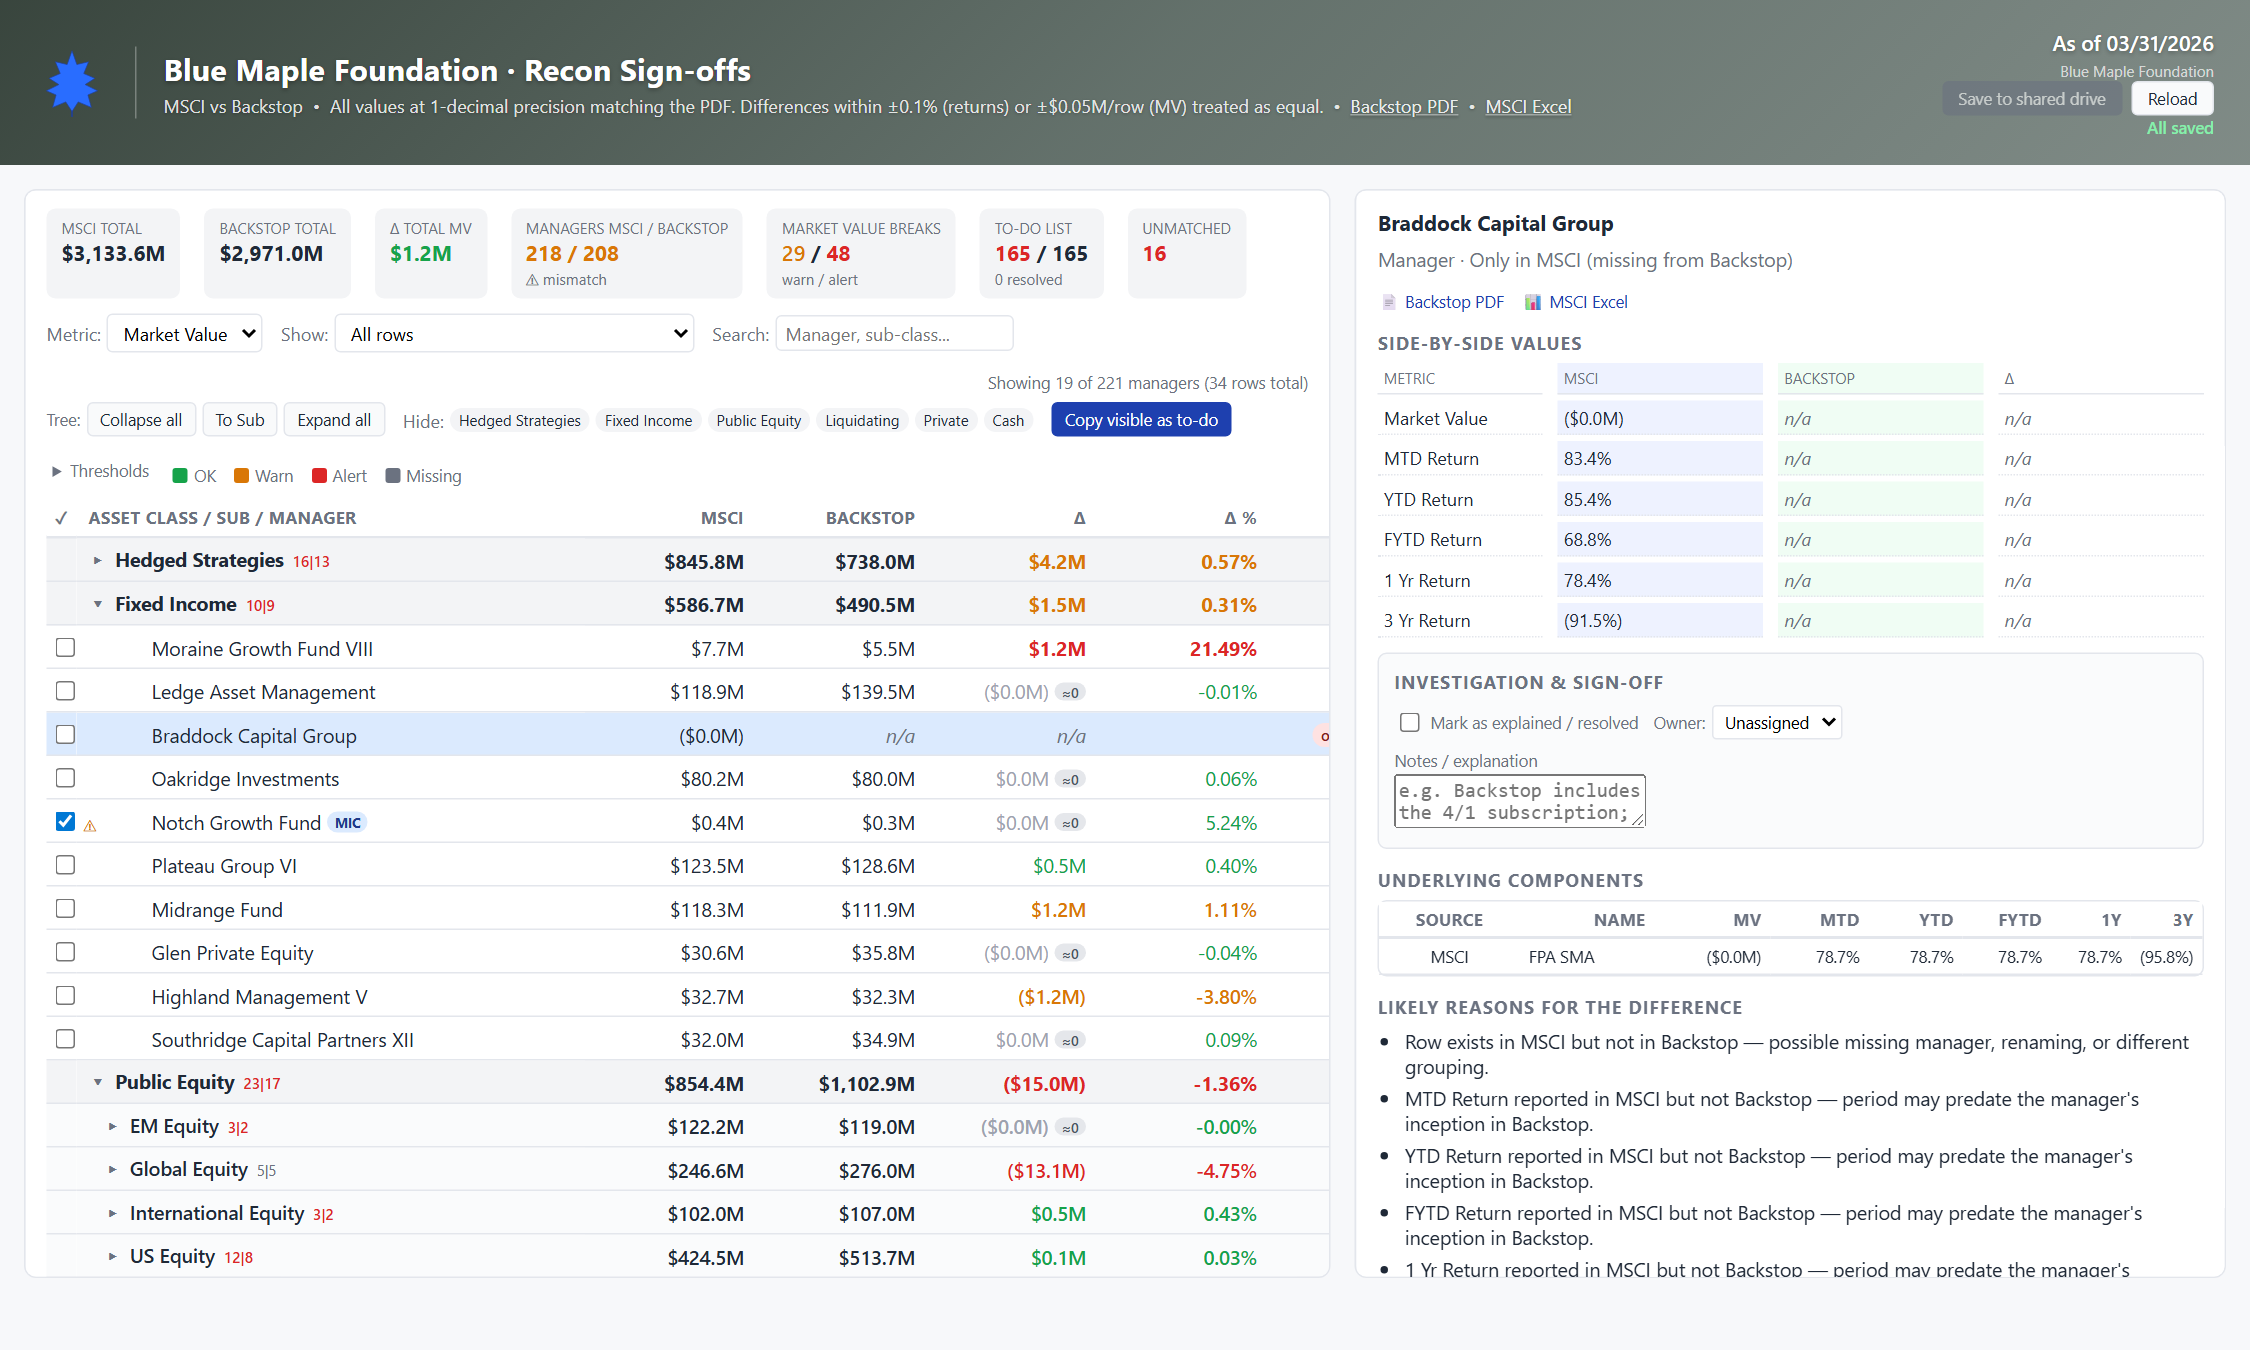
Open a manager's detail panel
Click any manager row. The right-hand pane shows: manager name + asset class header, side-by-side values for all six metrics (MV, MTD, YTD, FYTD, 1Y, 3Y) with deltas and effective deltas, the likely-cause hints, and the sign-off form.

Read the auto-generated hints
Below the side-by-side values, the dashboard lists plain-English hypotheses for what could explain the deltas. Examples: "Market value differs materially but returns match — likely a valuation-timing, FX, or cash/accrual treatment difference" or "Period may predate the manager's inception in Backstop." Six rule families cover most cases.
Sign the row off
In the sign-off form: pick an owner from the dropdown, type a note explaining what you concluded, click the checkbox. The row is now timestamped to you. The dashboard captures a snapshot of the deltas at sign-off time — if those numbers change later, the row goes stale and re-prompts.
Tune the tolerance thresholds
Open the Thresholds details panel (top of the toolbar). You can edit: MV warn/alert (absolute dollar), MV warn/alert (relative %), and return warn/alert (basis points). Defaults are conservative; adjust based on what your CIO cares about. Reset button restores defaults.
Save to the shared drive
In the live version, when you've completed your sign-offs the "Save to shared drive" button downloads an updated signoffs.js. Drop it back into the shared folder, and the rest of the team sees your sign-offs on their next reload. The save button is disabled until you have unsaved changes — an "All saved" indicator confirms when you're sync'd.
