01Why this exists
Public-fund reporting is monthly, not quarterly, and the metrics that matter are different: instead of TVPI / DPI / capital calls, the reviewer cares about returns across time windows (MTD, YTD, FYTD, trailing 1Y, trailing 3Y) and dollar PnL contribution across the same windows.
So the recon target shifts: not "do we agree on NAV?" but "do we agree on the return, and on the PnL it implies?" When MSCI and Backstop disagree by 30 bps on a fund's FYTD return, that's a real number — on a $200M position it can be $600K of PnL difference flowing into a board-level slide.
The dashboard is the public-fund sibling of the private-recon dashboard above, with the same scatter explorer + column-picker pattern, retuned for monthly returns & PnL.
02Data sources & pipeline
| Side | Source | Metrics captured |
|---|---|---|
| MSCI | Performance Overview Export (xlsx) | Market Value + 5 return windows + 5 PnL windows = 11 metrics |
| Backstop | Performance Report (xlsx) | Same 11 metrics, joined by vehicle ID |
| PCAP | Monthly factsheets (PDF) | Same 11 metrics, extracted with Anthropic API + confidence scores |
Schema-wise this dashboard is a sibling of the private one but joins through a vehicle table (with explicit manager_name, sub_asset_class) instead of a fund table. The snapshot tables (msci_snapshot, backstop_snapshot, pcap_extraction) all store the same 11 metrics: market_value + ret_mtd / ret_ytd / ret_fytd / ret_trail_1y / ret_trail_3y + pnl_mtd / pnl_ytd / pnl_fytd / pnl_trail_1y / pnl_trail_3y.
The status logic uses Market Value as the anchor (same as private) — a fund matches if MSCI MV and Backstop MV agree to within 5%. That's an opinionated choice: in practice if MV agrees, returns generally agree too, so MV is the right "is this the same thing?" signal even when the picked scatter metric is something else.
03Salient features
Scatter for any metric pair
11 metric choices (MV + 5 returns + 5 PnLs), 3 system choices for each axis. The axes auto-format between $M (for MV / PnL) and % (for returns). Diagonal reference + colour legend.
Heavy column picker
33 metric columns + 5 static = 38 total. The picker opens from the toolbar; default view hides PnL columns, trailing-1Y/3Y returns, and PCAP entirely so you start with 16 visible columns.
Resizable columns under groups
Same column-resizer JS as the private dashboard, but here it has to navigate a two-row header with grouped colspans — the resizer attaches grips to the leaf row so it works under the super-header.
Monthly period selector
Three sample months (Jan / Feb / Mar 2026). The scatter, summary cards, and table re-render together.
Filter by manager too
Public funds have a manager column (BlackRock, Vanguard etc. in the production version — mountain-themed in the demo). Search by manager name or fund name in one filter field.
Same status semantics
Match / Variance / Mismatch badges based on MV delta, identical to the private dashboard so the team has one mental model.
04How to use it
Demo URL: public-recon.html.
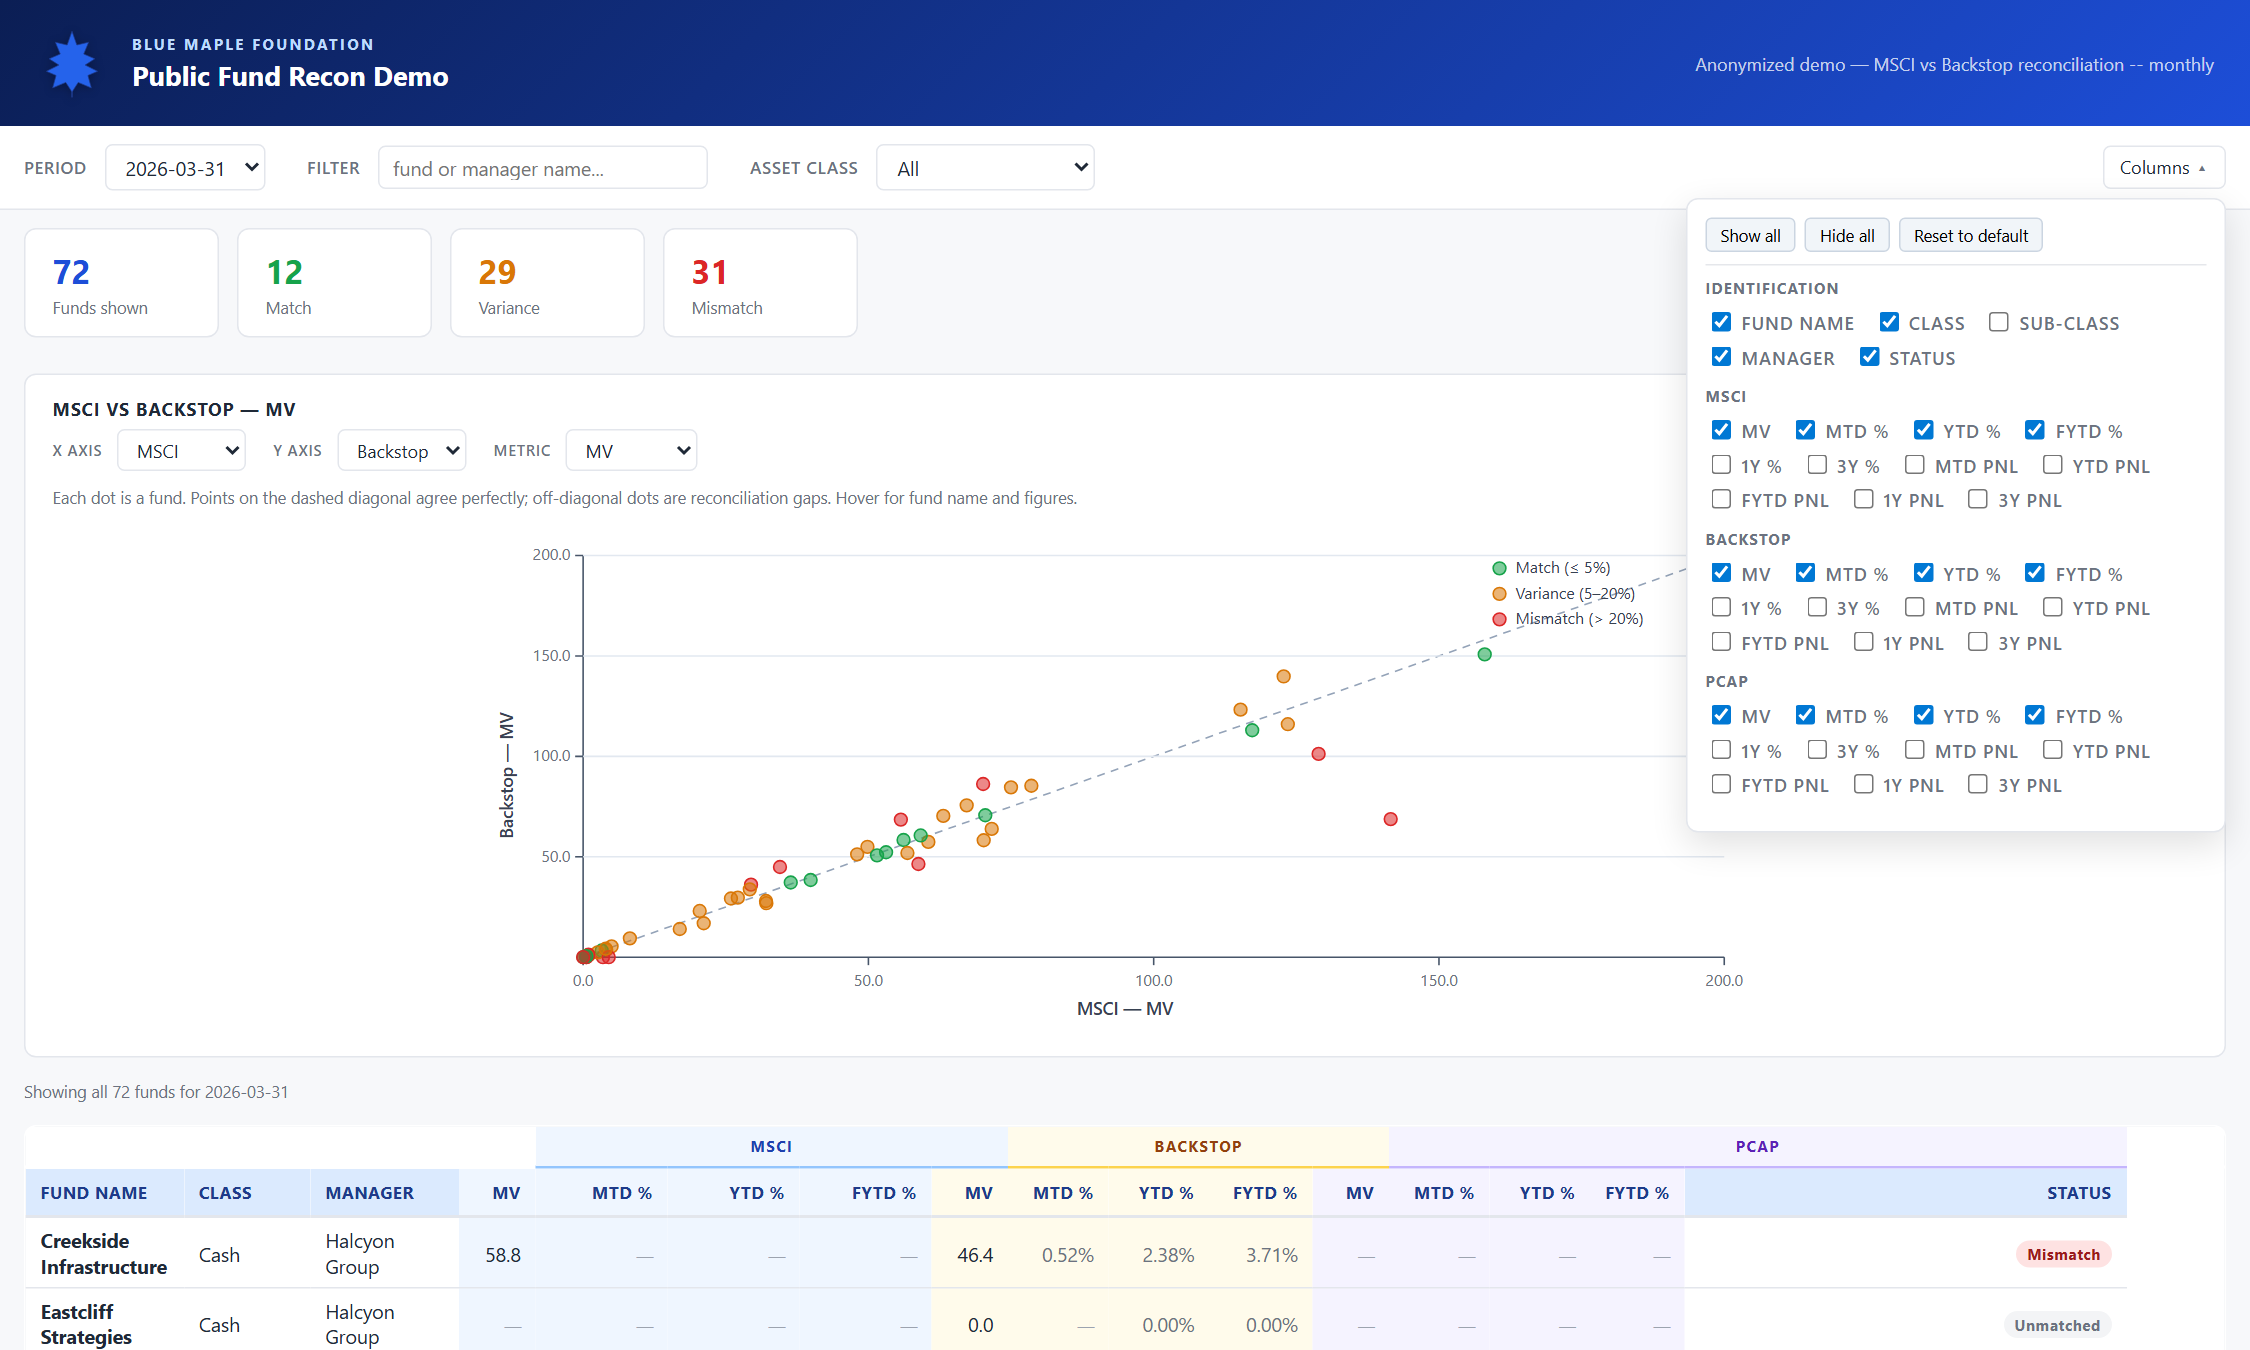
Land on the default view
Same hero strip and toolbar as the private dashboard. The summary cards count funds and statuses for the picked period; below them is the scatter plot; below that the table.
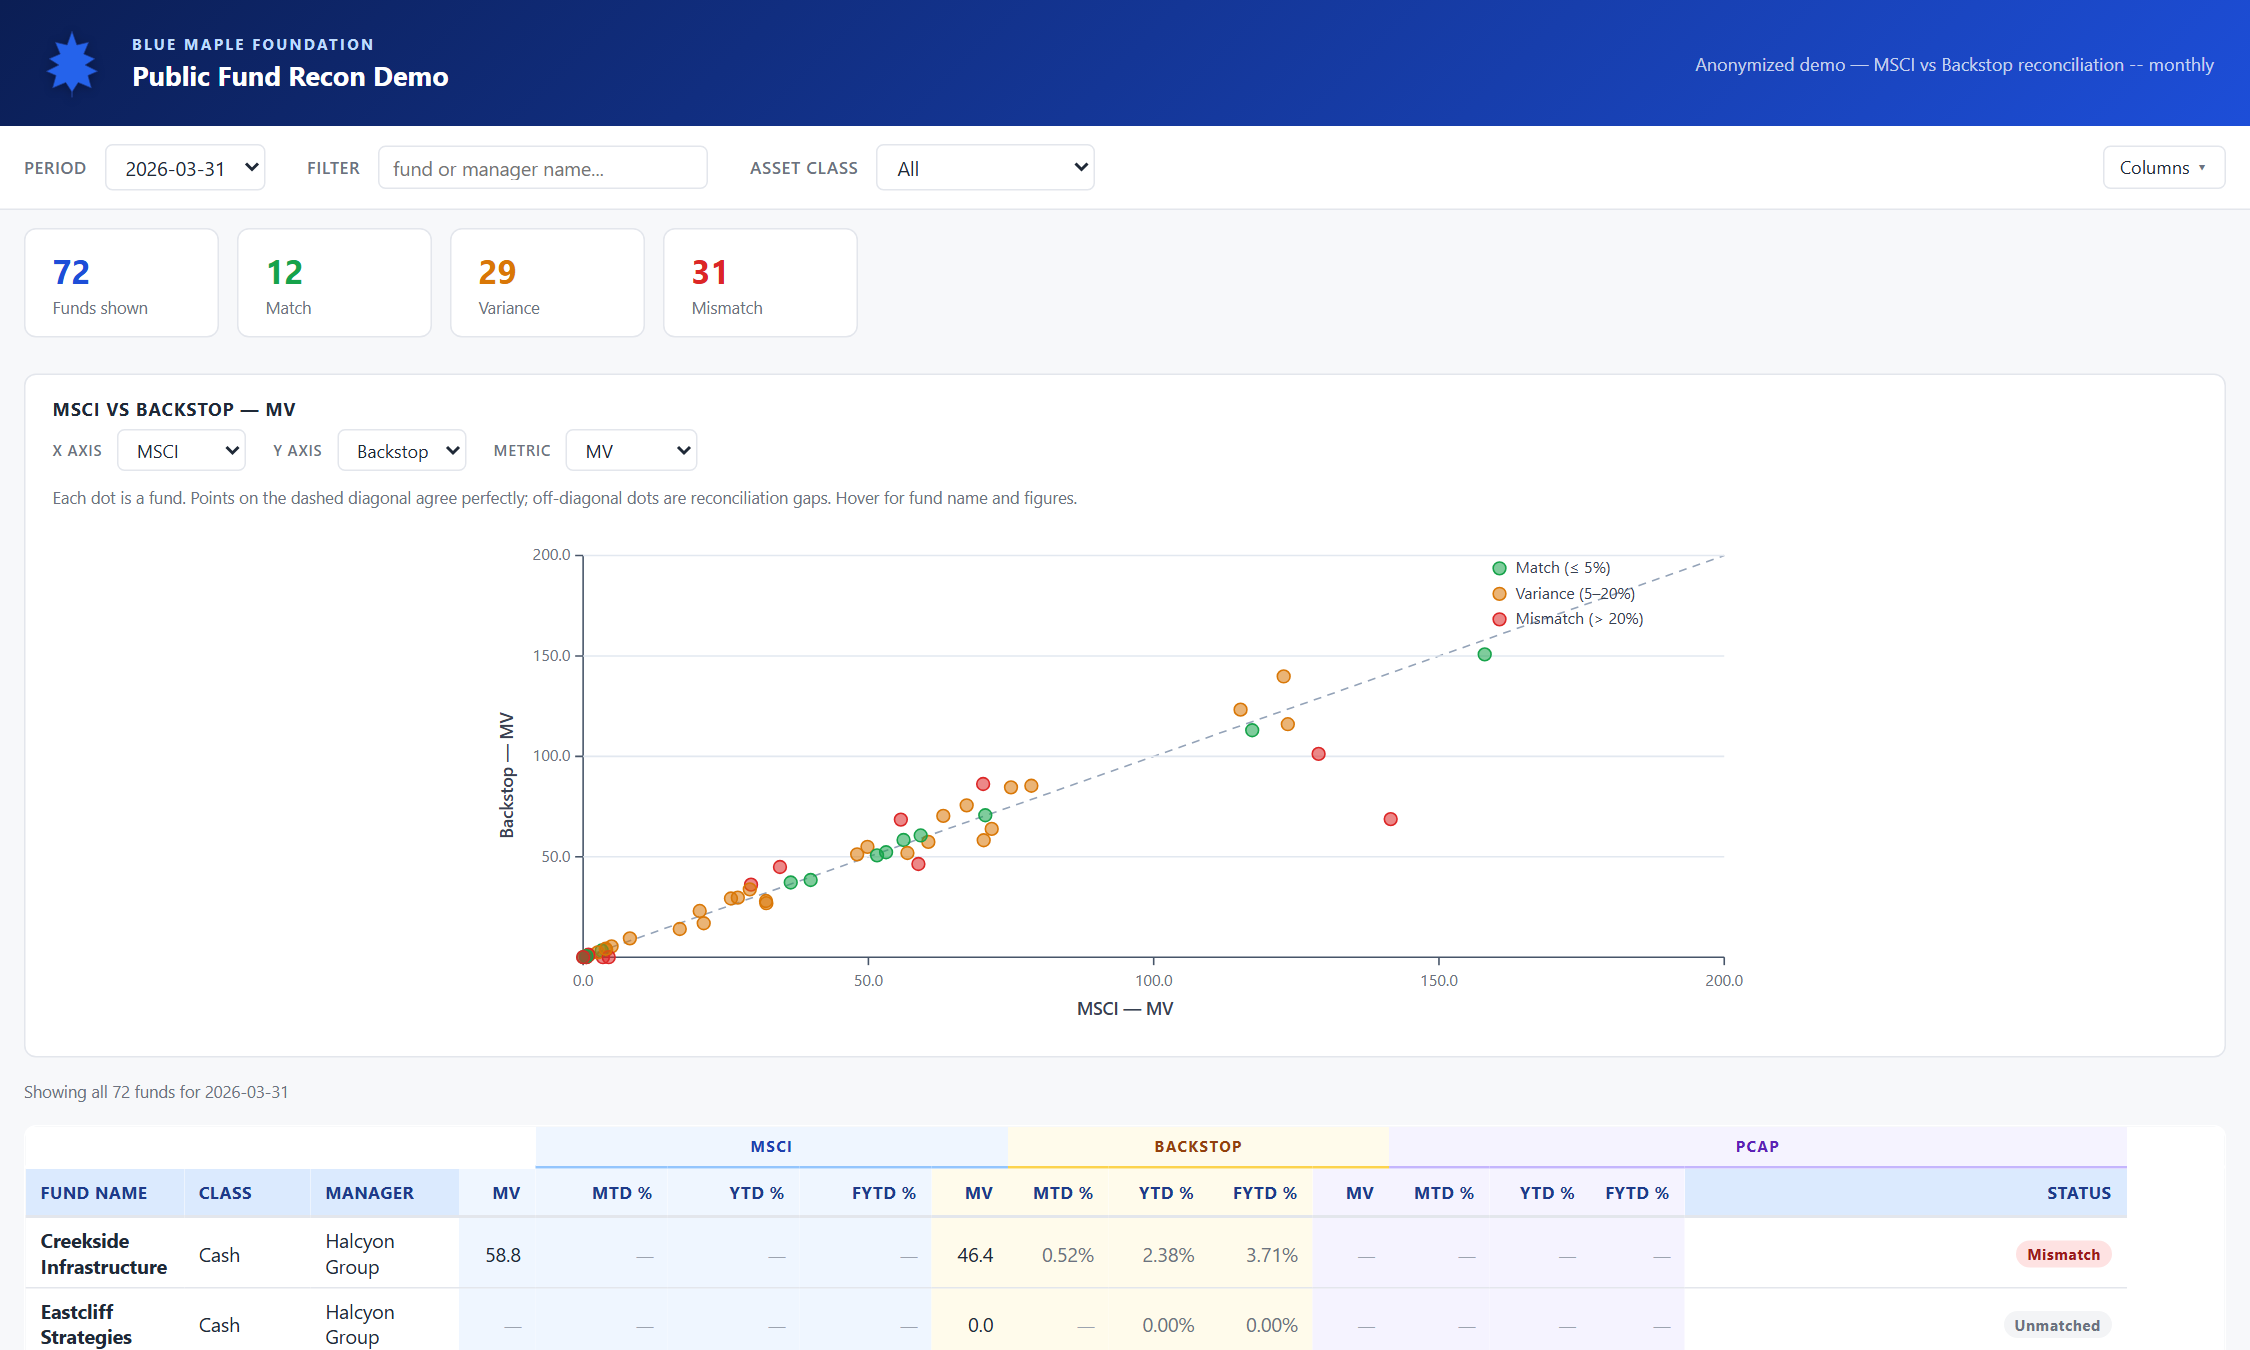
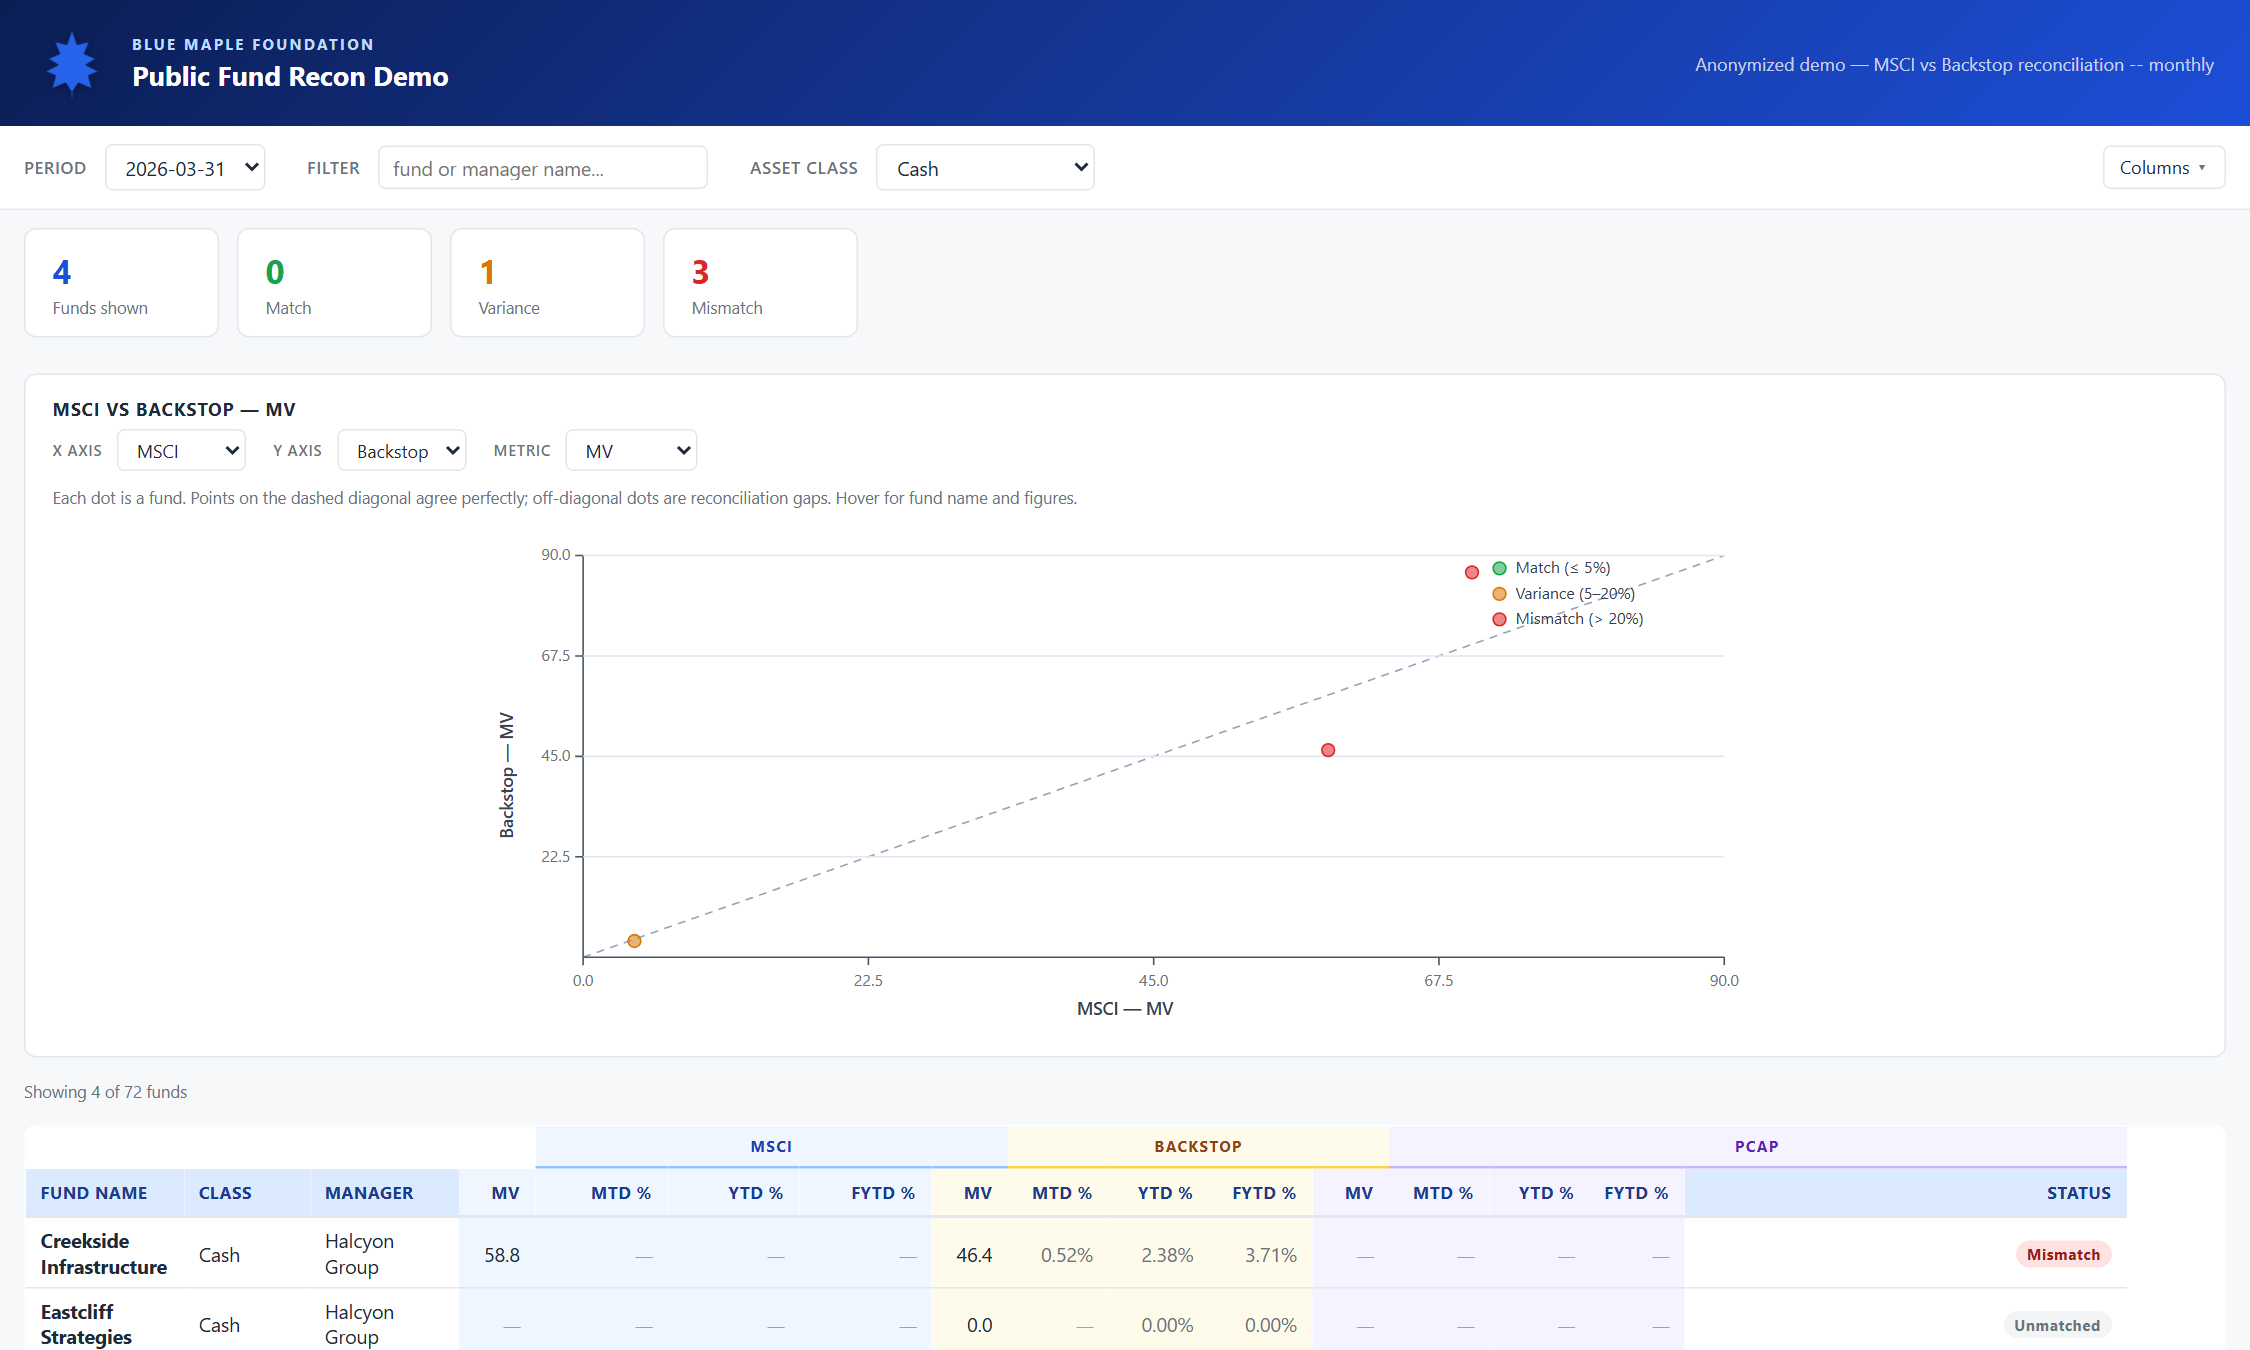
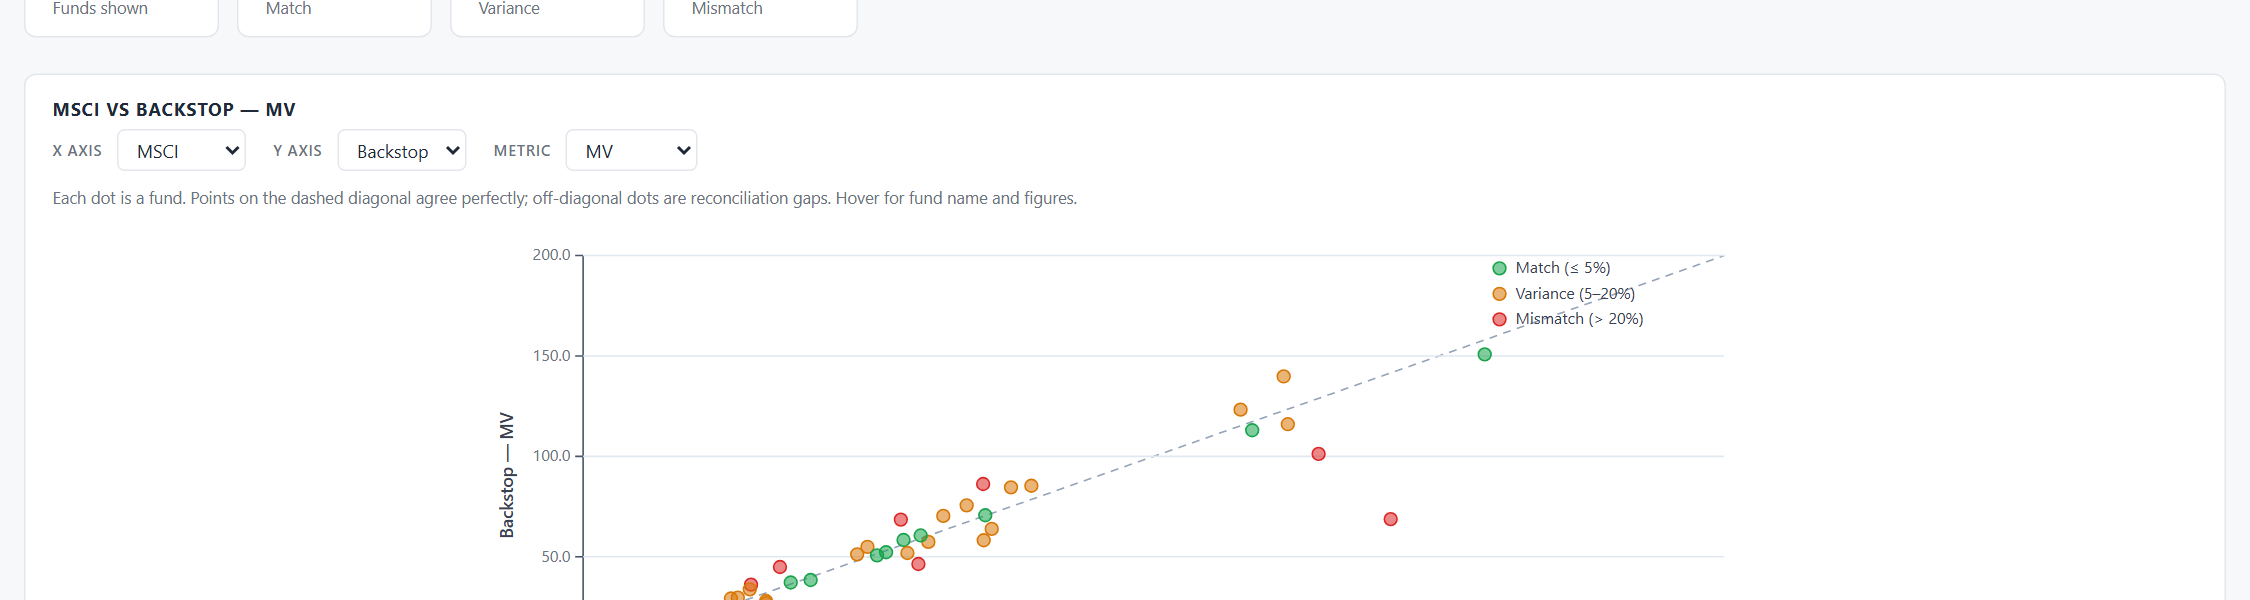
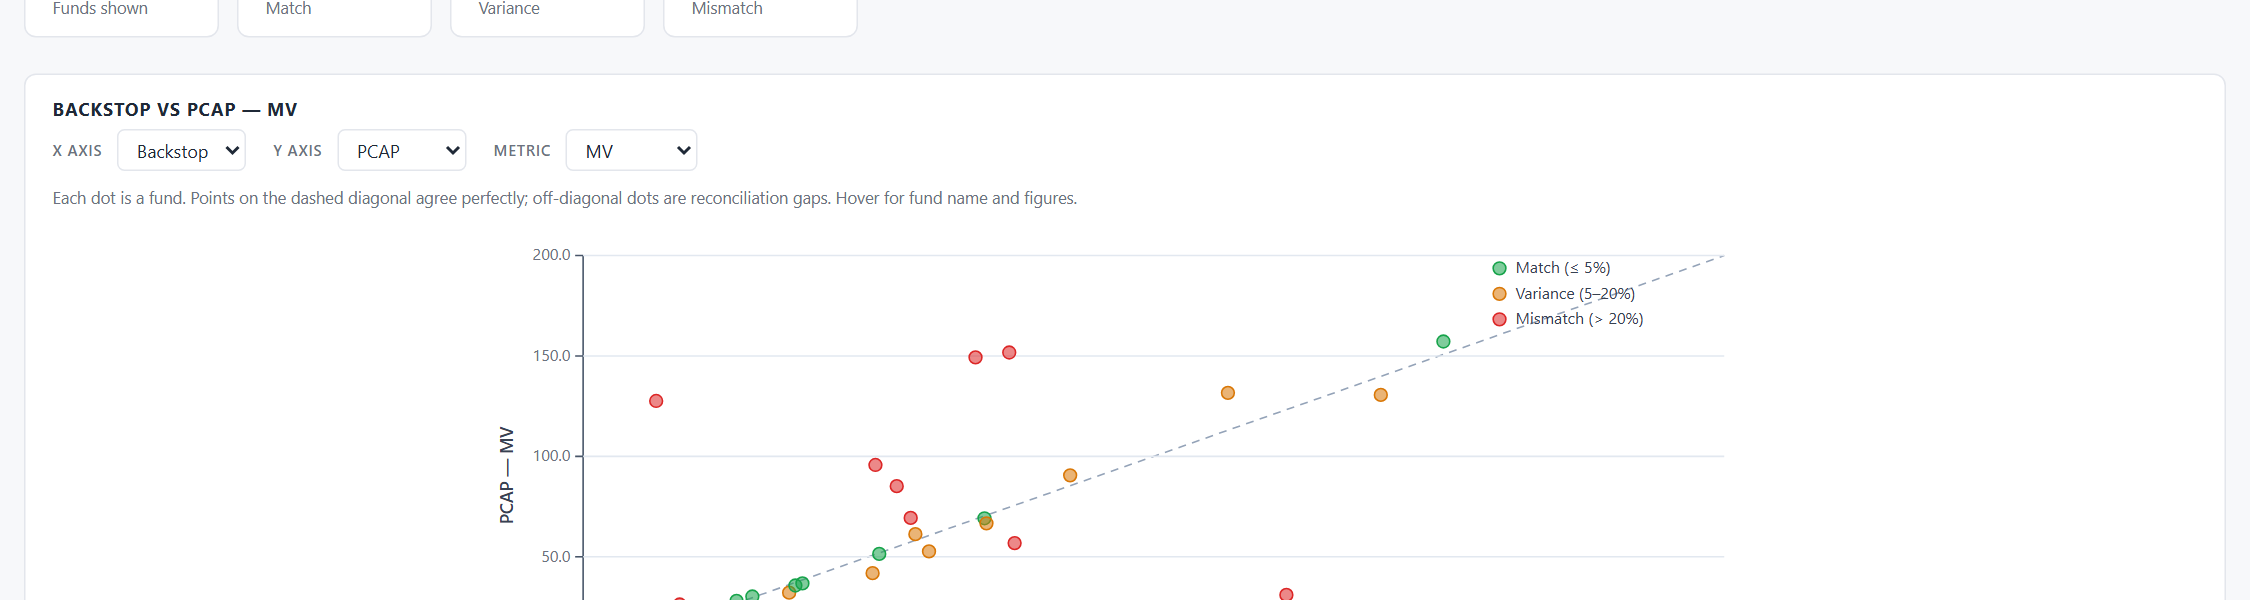
Read the MV scatter
Default scatter is MSCI Market Value (x) vs Backstop Market Value (y) in millions. Diagonal reference line; dots tinted by match status. Hover any dot for fund name and figures.
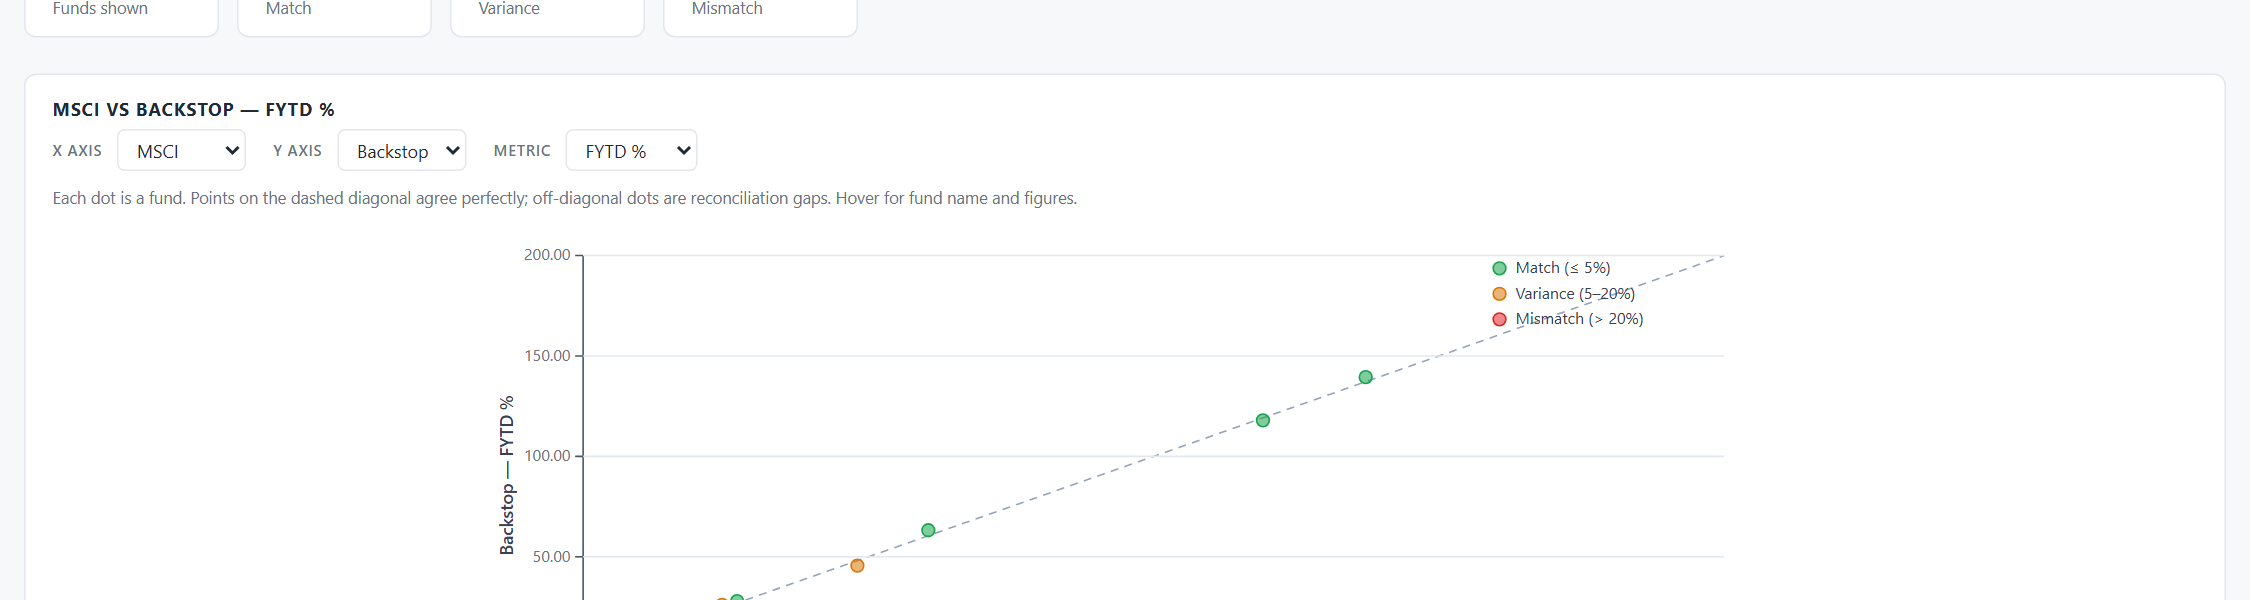
Switch to a return metric
Pick FYTD Return from the Metric dropdown. The scatter rescales — axes are now labelled "MSCI — FYTD Return" and "Backstop — FYTD Return", values formatted as percentages with two decimals. Tooltip values switch to % too.
Compare back-office sources
Set X = Backstop, Y = PCAP, Metric = MV. This isolates back-office ↔ manager-statement gaps (independent of MSCI). Useful when you suspect a data-entry issue in the holdings system.
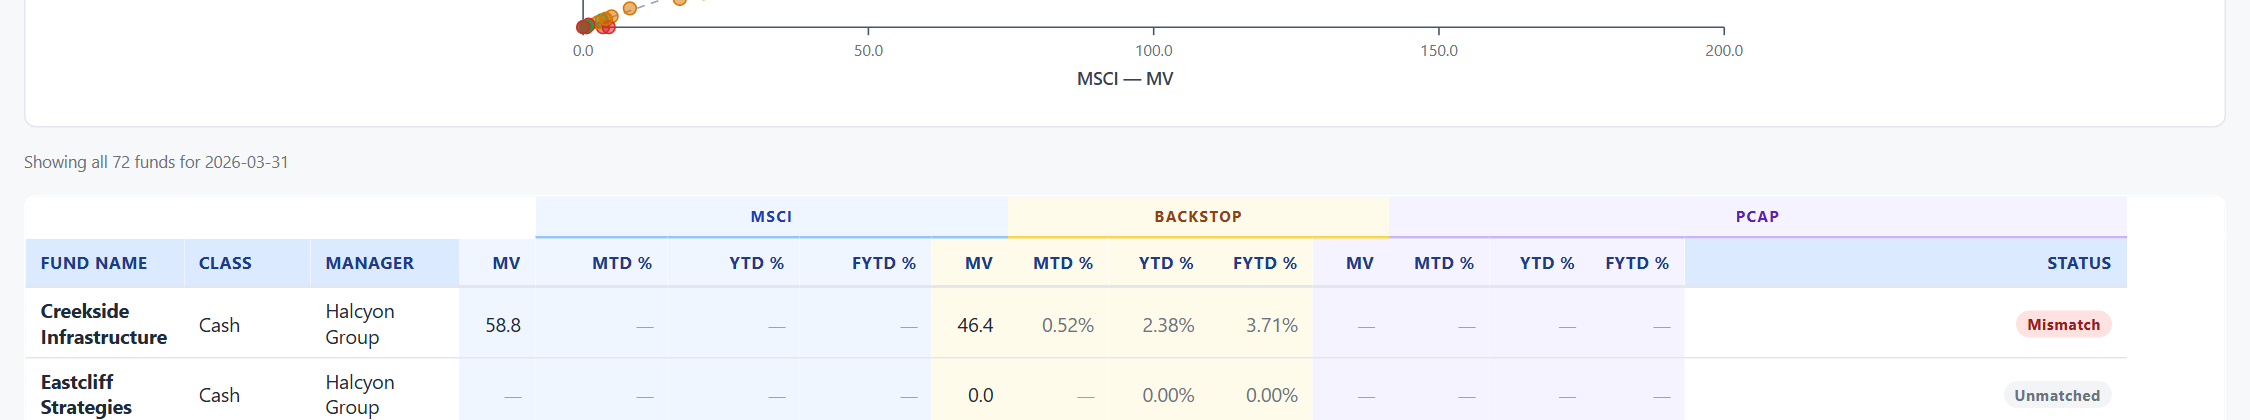
Look at the default table
Default visible columns: 4 static (Fund / Class / Sub-class / Manager) + Market Value + MTD / YTD / FYTD returns for MSCI and Backstop = 12 metric columns, 16 total. PnL and trailing-1Y/3Y are hidden; PCAP is hidden entirely.
Open the column picker
Click "Columns" on the right side of the toolbar. A panel opens with 38 checkboxes grouped under Identification, MSCI, Backstop, PCAP. Tick any combination; group colspans auto-recalculate so the super-headers always span the right number of cells.
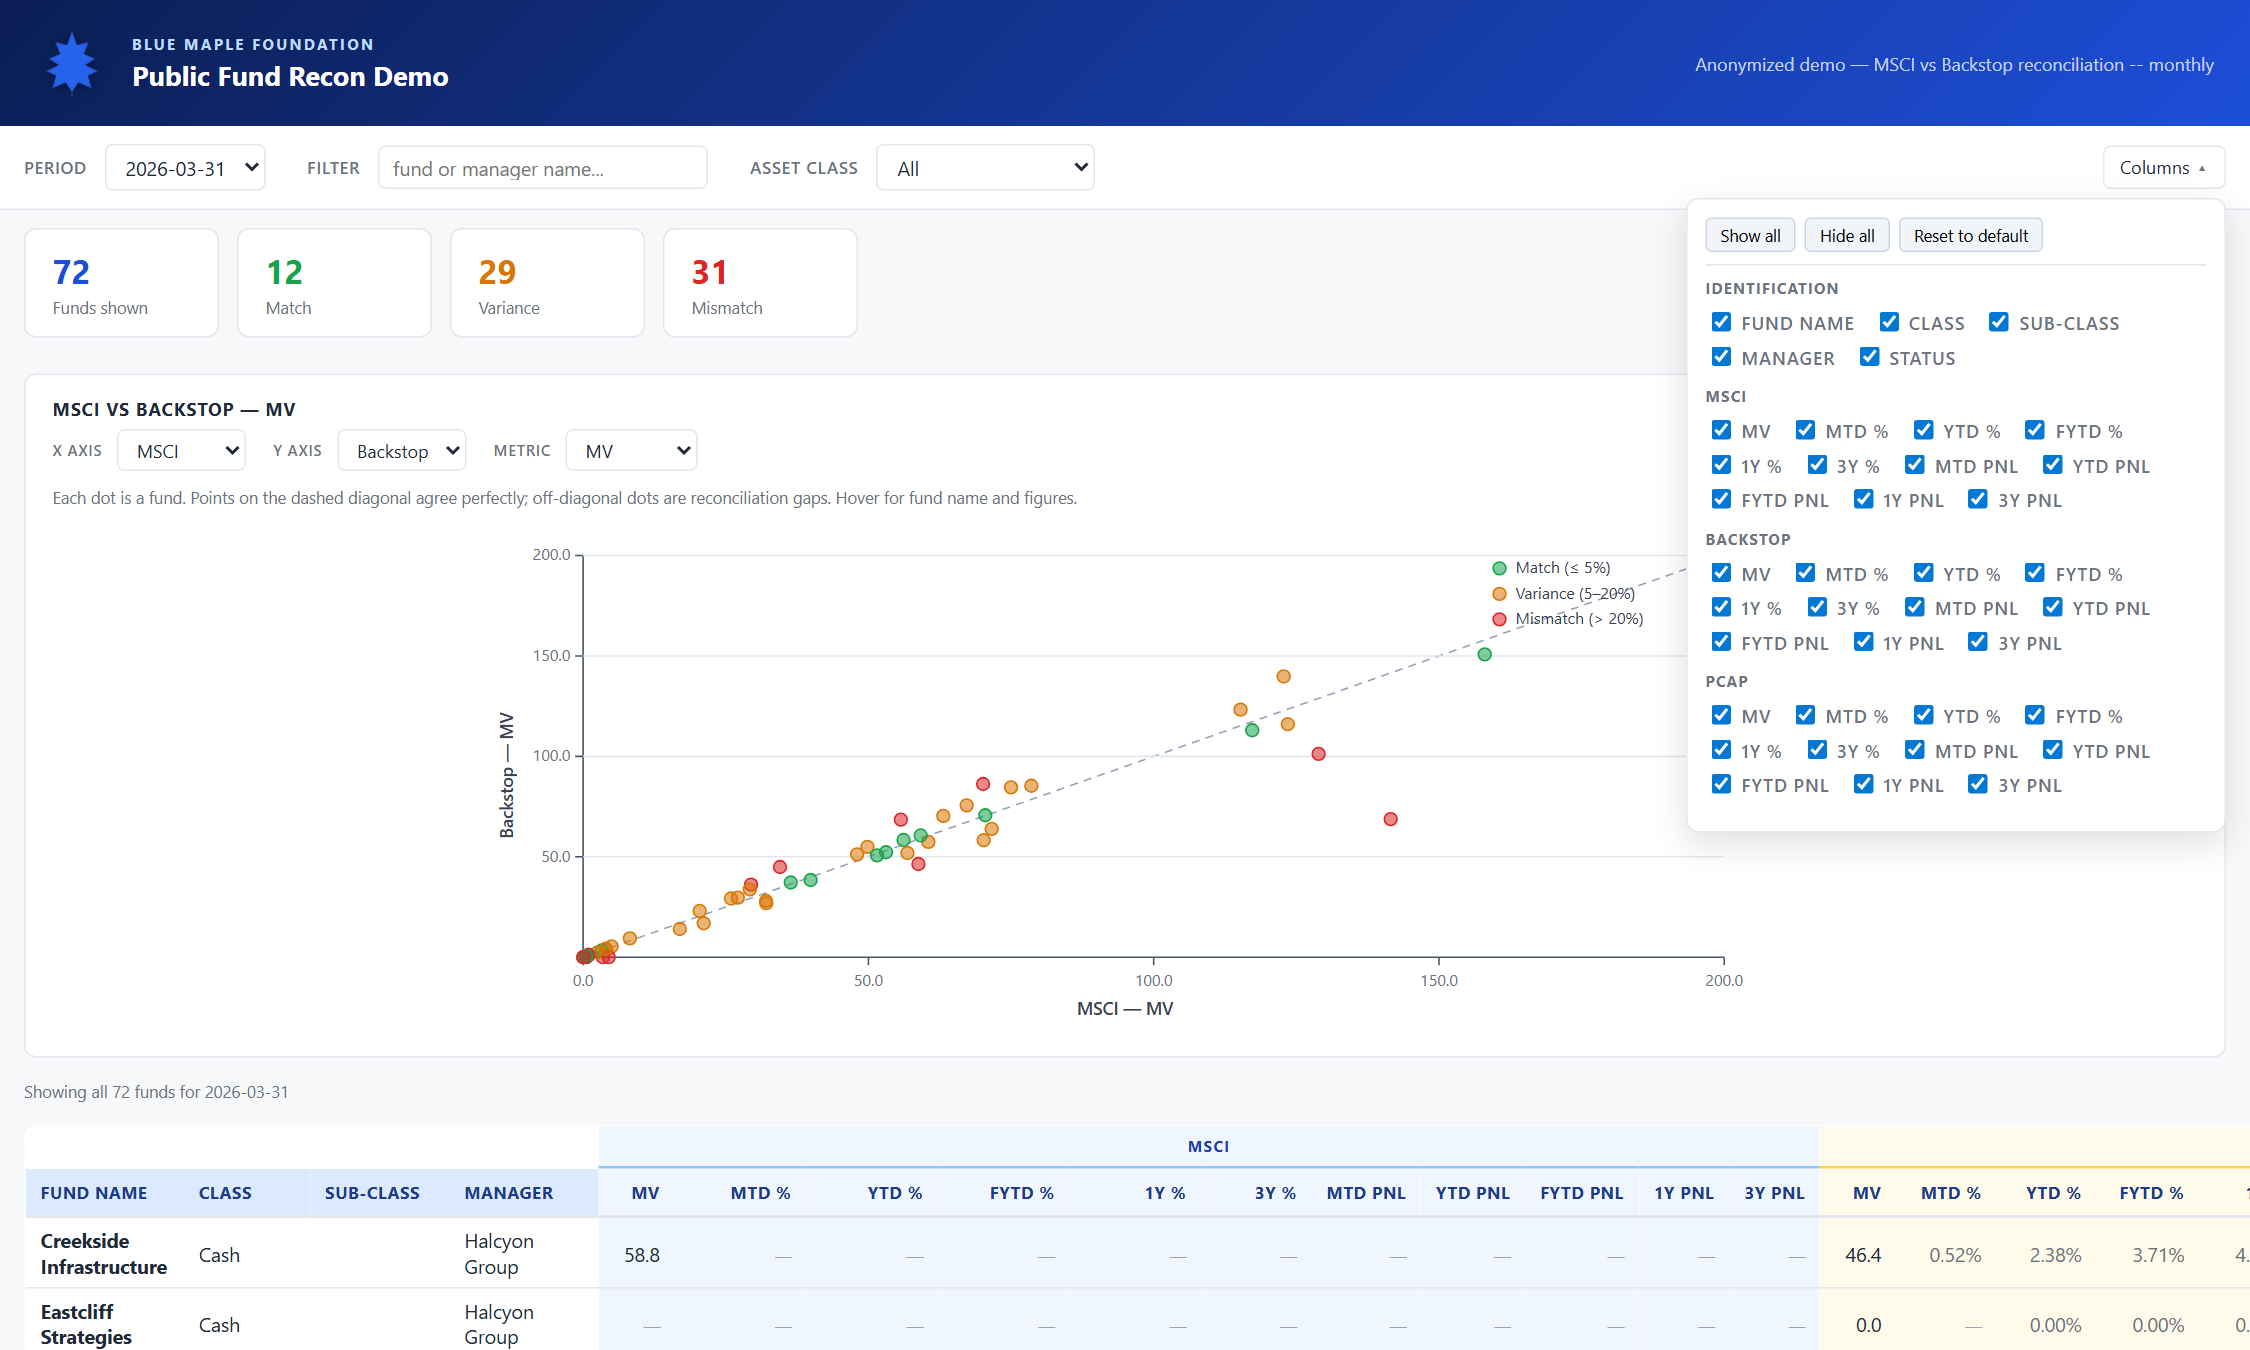
Show every column
Click "Show all" to expose all 33 metric columns at once. The table scrolls horizontally; column resizers still work; group super-headers still tint correctly. Useful when you need to drill into one row in full detail.
Filter by asset class or manager
The Filter box matches against fund name, manager name, and asset class substring. The Asset class dropdown filters by exact class. Both are additive with each other and with the period selector.