01Why this exists
Private funds report quarterly via capital account statements (PCAPs) — PDFs that arrive separately for every fund, in every fund's own template. By the time they're loaded into Backstop and then aggregated into MSCI's quarterly export, three versions of the truth exist for each fund:
- The PCAP itself — what the GP says
- Backstop's snapshot — what the back office booked
- MSCI's export — what the analytics platform shows
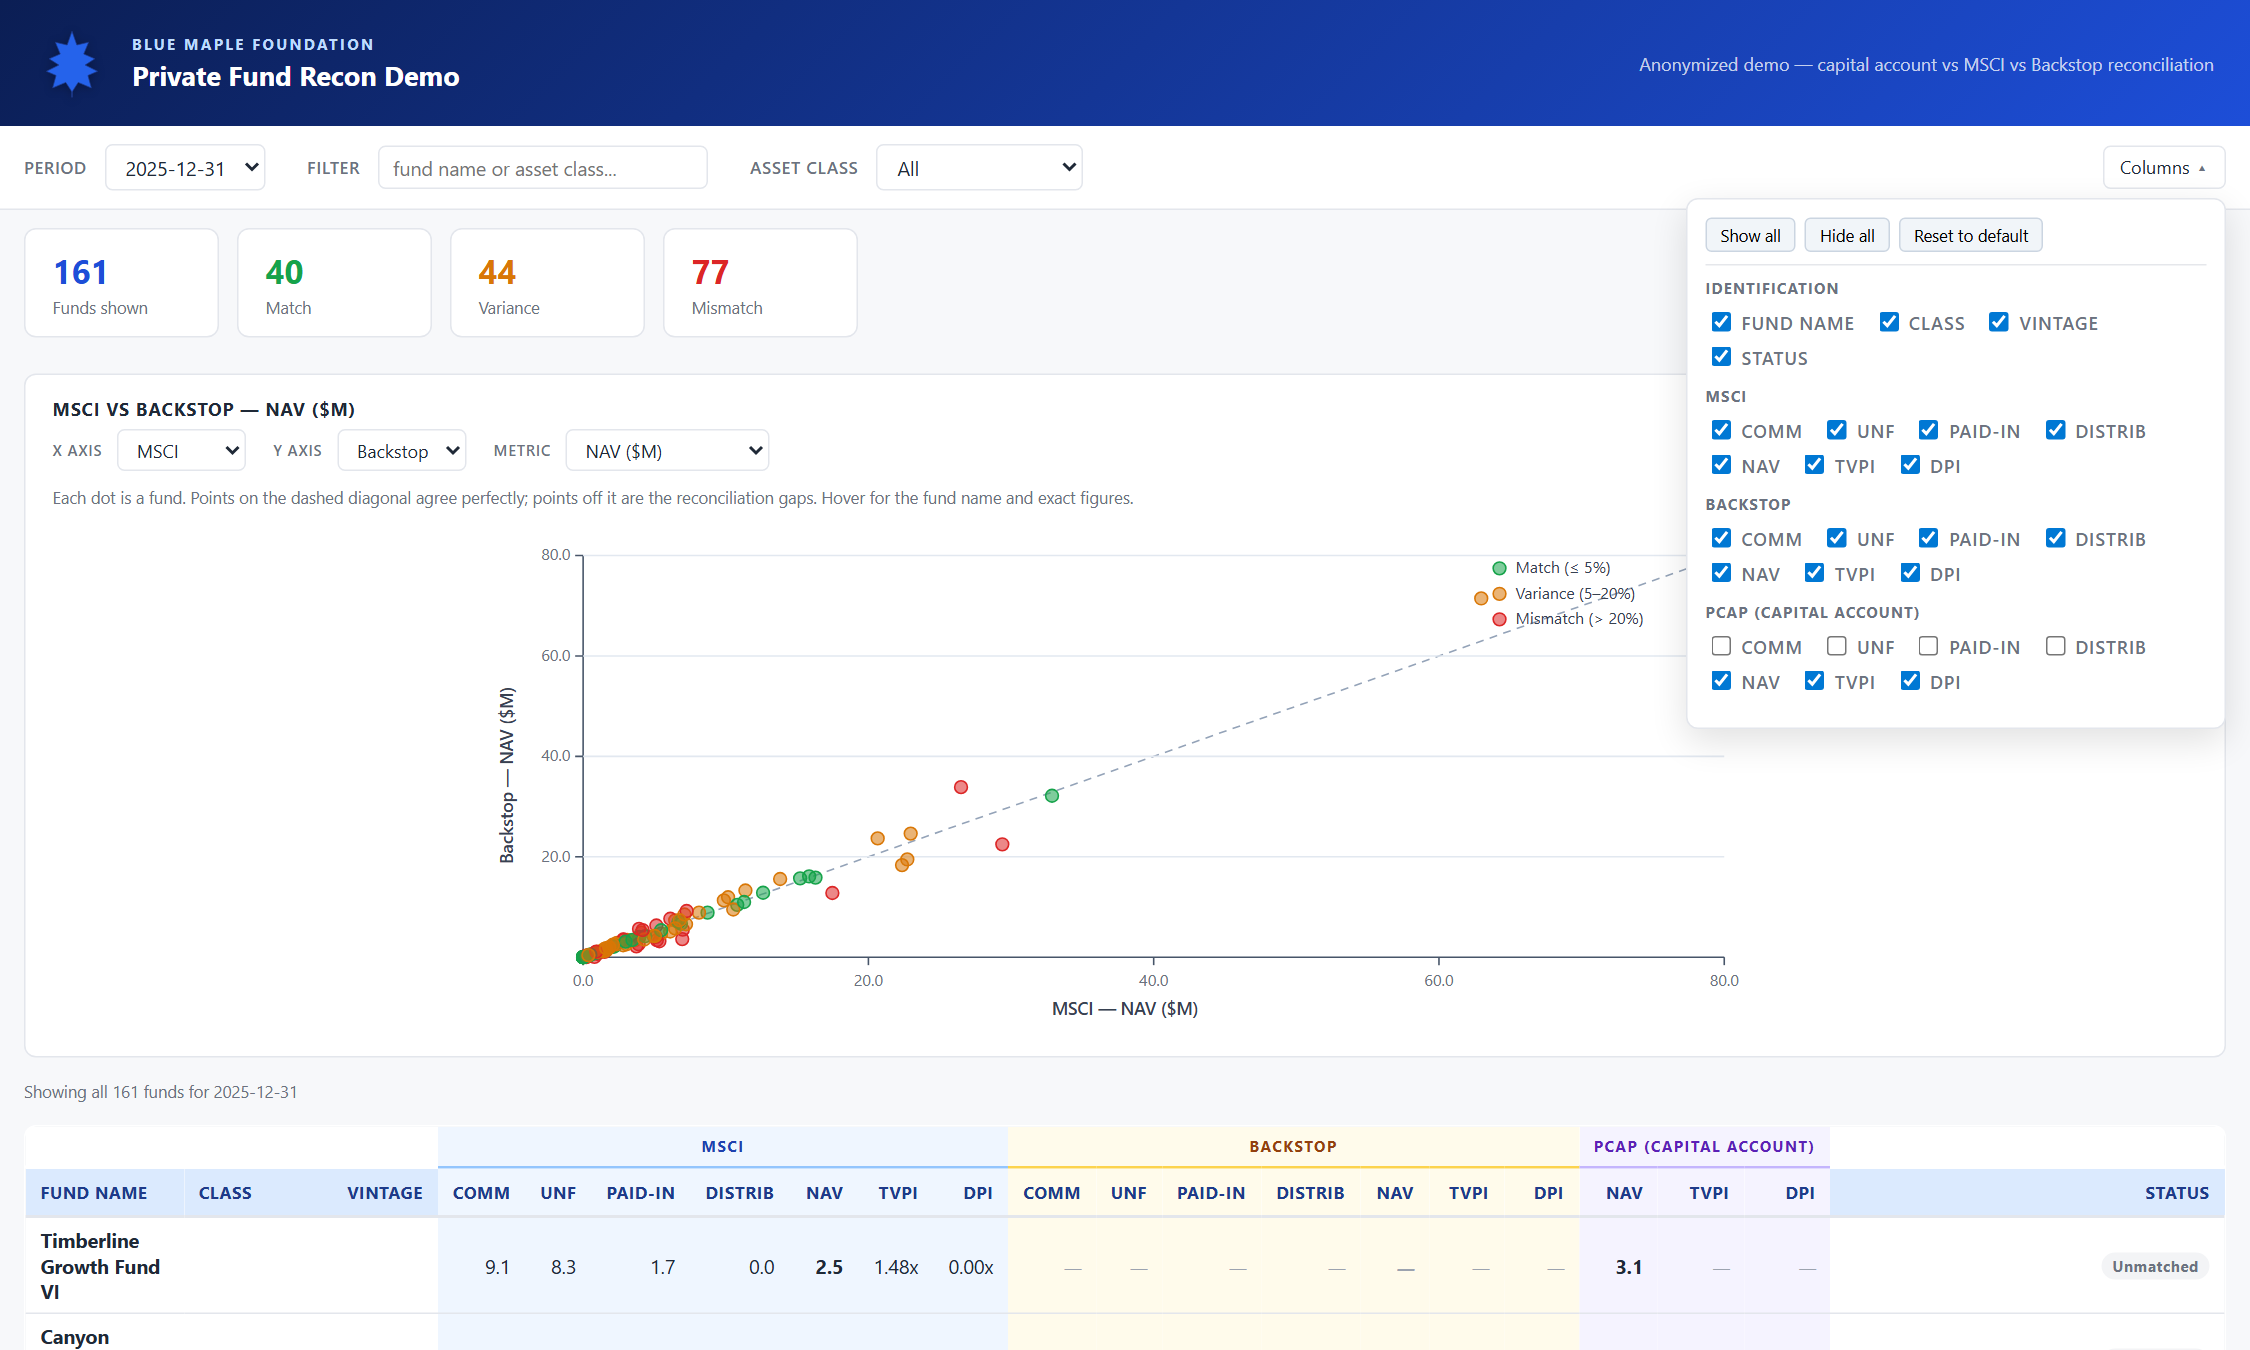
For 160+ funds, manually reading three sources and tracking which ones agree is a multi-day quarterly exercise. This dashboard collapses it into one screen with a scatter plot and a filterable table. A glance tells you which funds agree (dots on the diagonal) and which ones don't.
02Data sources & pipeline
This dashboard is a static snapshot of a live FastAPI + SQLite backend. The live version supports adding annotations, marking cells crossed-off, and proposing fix transactions; the demo shows the read-only view.
| Source | Format | Tables touched |
|---|---|---|
| MSCI quarterly export | Excel | msci_snapshot — commitment, unfunded, paid-in, distributions, NAV, TVPI, DPI |
| Backstop holdings export | Excel | backstop_snapshot — same 7 metrics + manager name + matched-by |
| Capital account statements | ~100 PDFs per quarter | pdf_extraction — same 7 metrics extracted via the Anthropic API with confidence scores |
| Fund metadata | Backstop master list | fund — fund name, asset class, vintage, currency, canonical name |
For each PDF the LLM is asked to produce a structured JSON: commitment, unfunded, paid-in since inception, distributions since inception, ending NAV, DPI, TVPI. Every field comes back with a page reference, the verbatim text snippet it was pulled from, and a confidence label (high / medium / low). Low-confidence extractions get flagged for human verification in the dashboard's live mode — so the auto-extraction is fast where the PDF is unambiguous and conservative where it isn't. The verbatim snippet means a reviewer can audit any number back to the page and line in the original statement.
Funds are matched across sources using a cascade: MSCI ID first (when present), then Cambridge ID, then BNY IAS account number, then fuzzy name match. The match method is stored alongside the snapshot so the recon team can see how confident the join is.
03Salient features
Scatter plot explorer
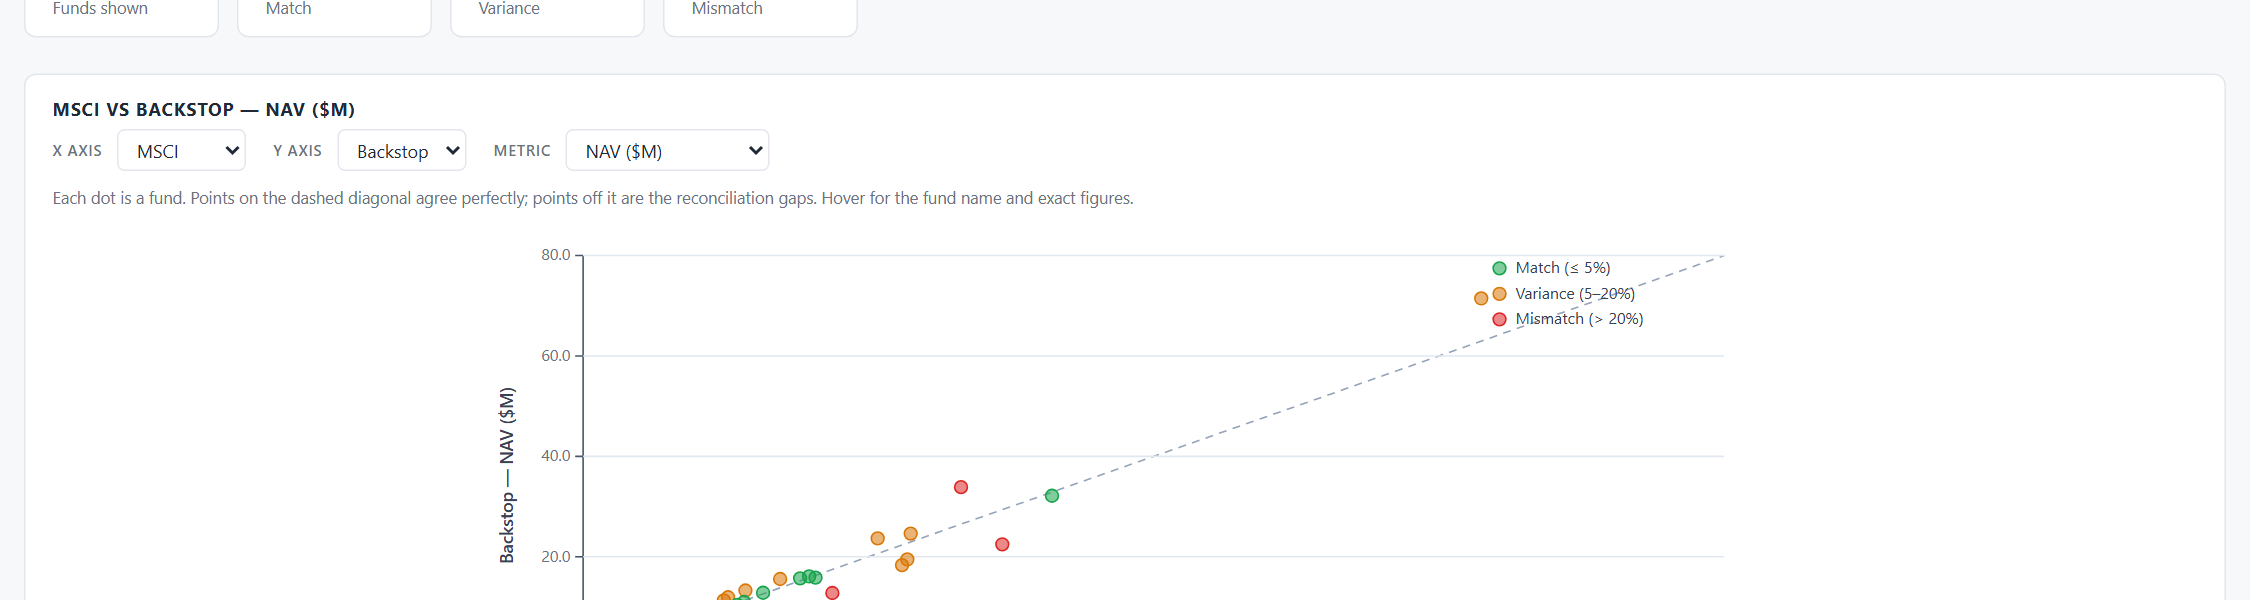
Pick any X system, any Y system, and any of seven metrics — the scatter re-plots in real time. Dots on the dashed diagonal agree perfectly; off-diagonal dots are the recon gaps.
Column visibility picker
21 metric columns plus 4 static columns. The picker opens from the toolbar; check or uncheck any column. Selections persist in localStorage and group colspans auto-update.
Column resizers
Drag the right edge of any column header to resize. Double-click the grip to reset to auto width. Works even with the grouped two-row header.
Period selector
Switch between quarterly periods (e.g. 2025-06-30 → 2025-09-30 → 2025-12-31). The scatter, status cards, and table all re-render.
Asset class filter + search
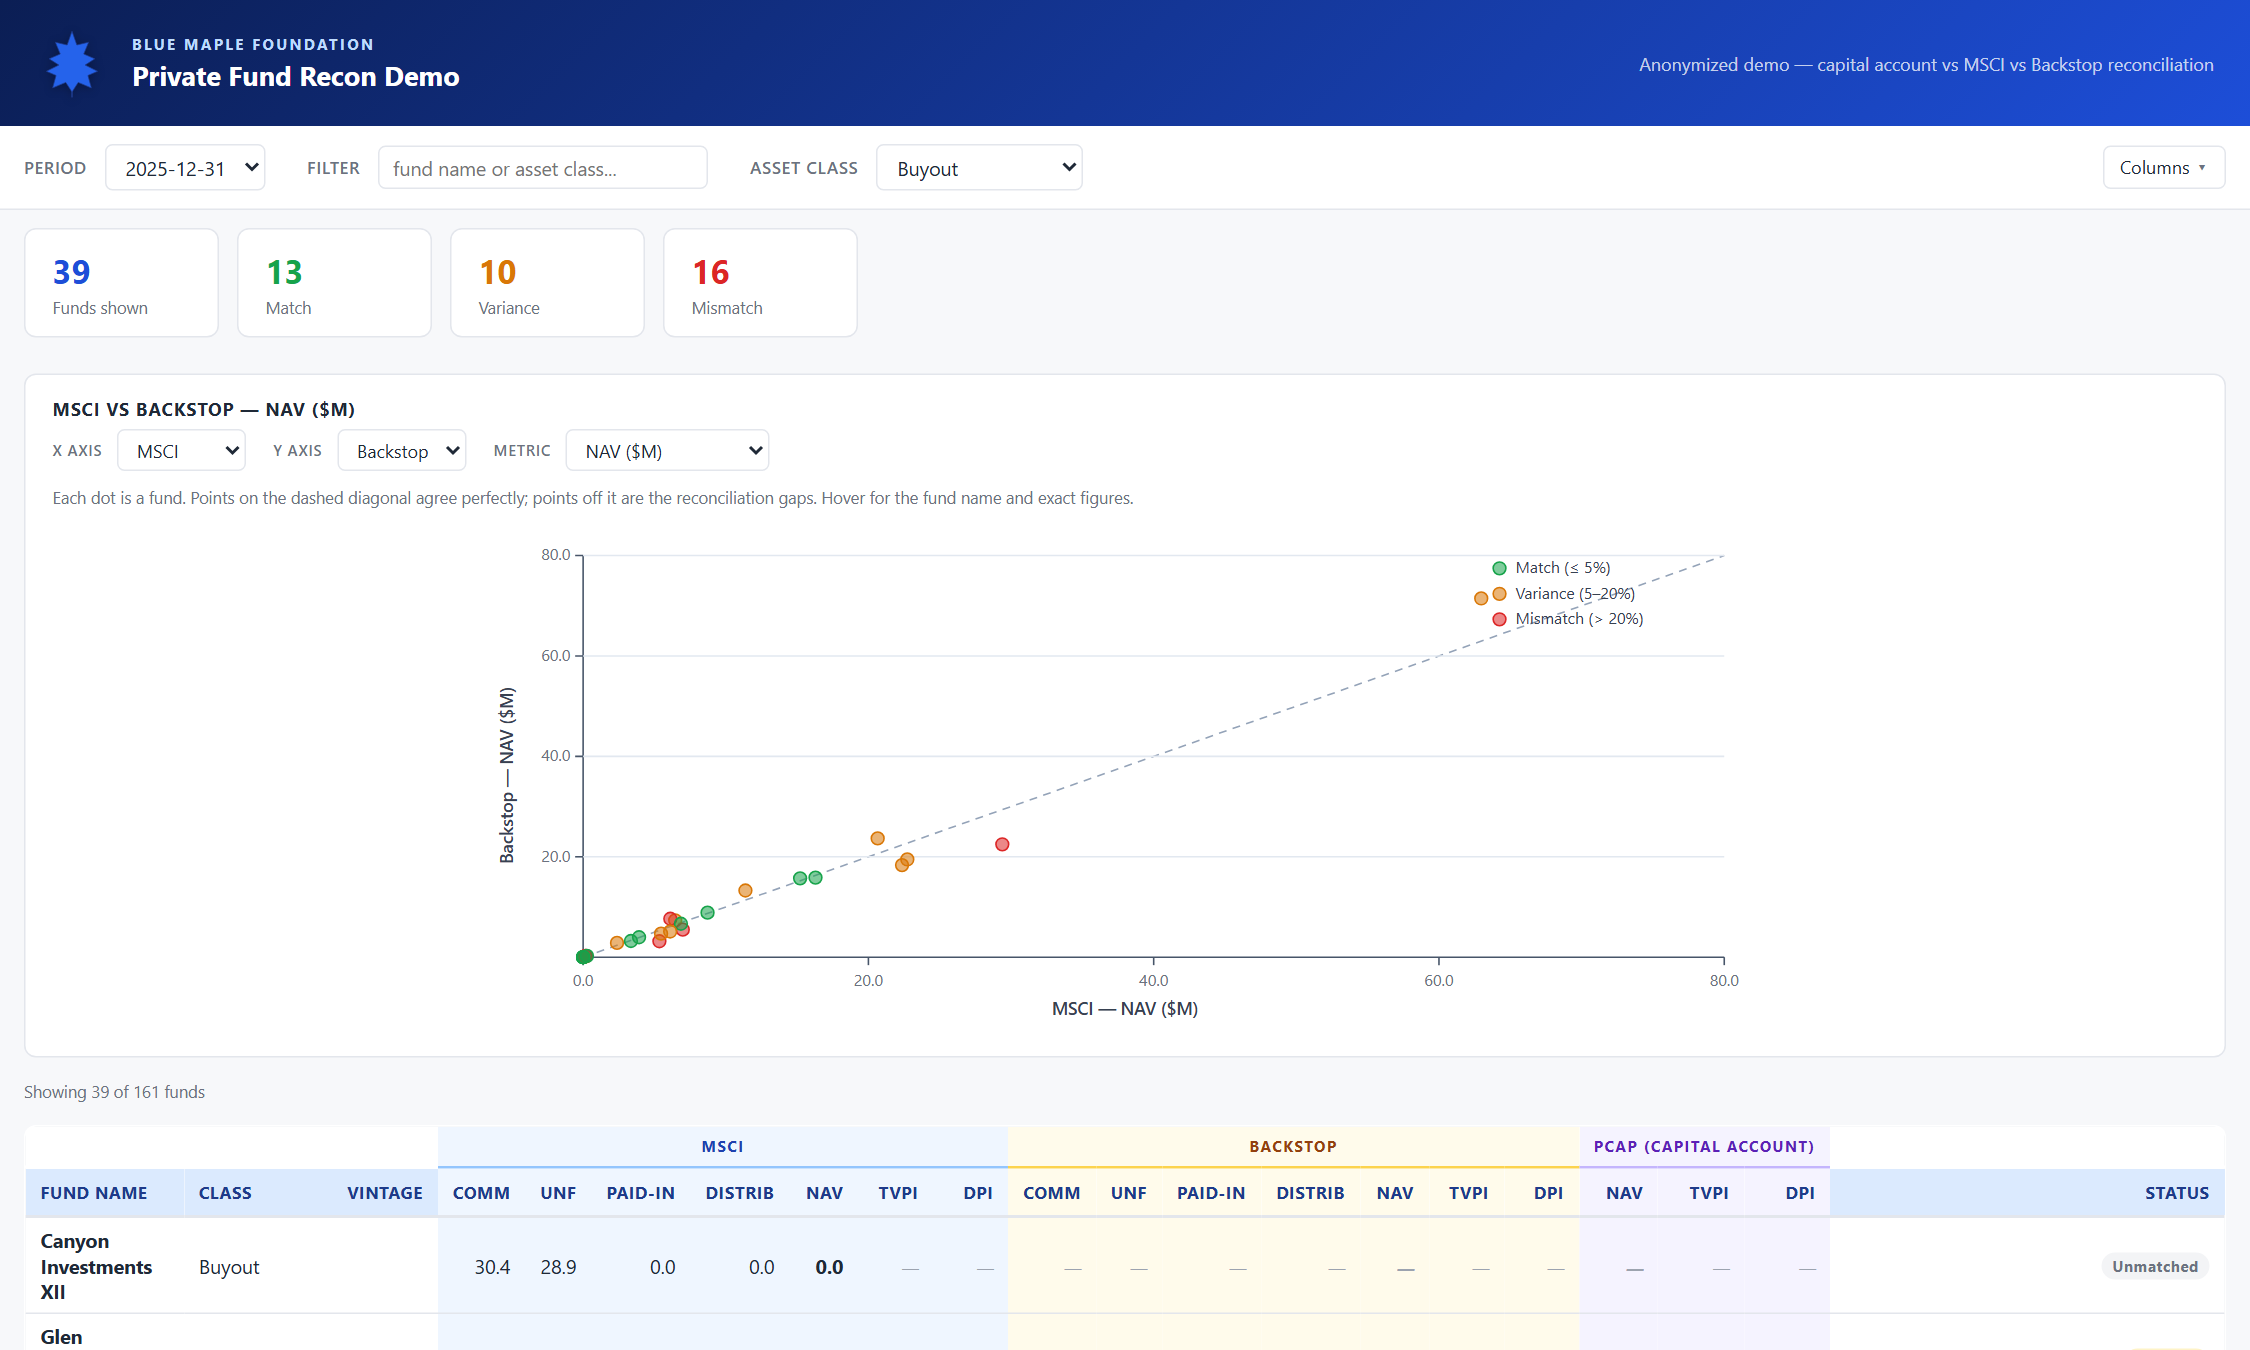
Drop down to filter to one asset class (Buyout, Growth, Venture, Real Assets, etc.) or type a fund name in the search box to scope the table.
Status badges
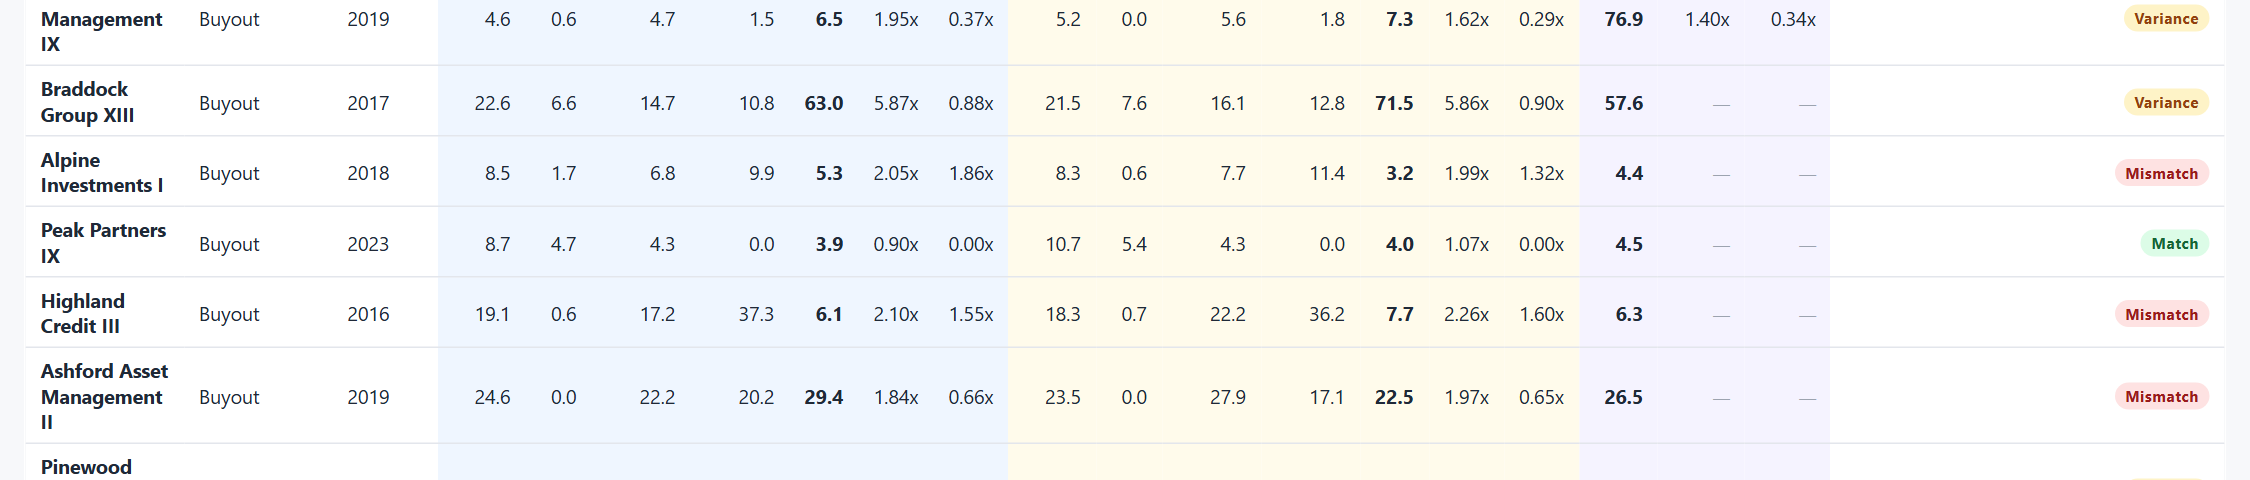
Each fund is auto-tagged: Match (≤ 5% delta) · Variance (5–20%) · Mismatch (> 20%) · Unmatched (one side missing).
04How to use it
Demo URL: private-recon.html.
Land on the dashboard
Top is the brand strip and period selector (defaults to the most recent quarter). Below: four summary cards (funds shown / match / variance / mismatch), then the scatter plot, then the table.
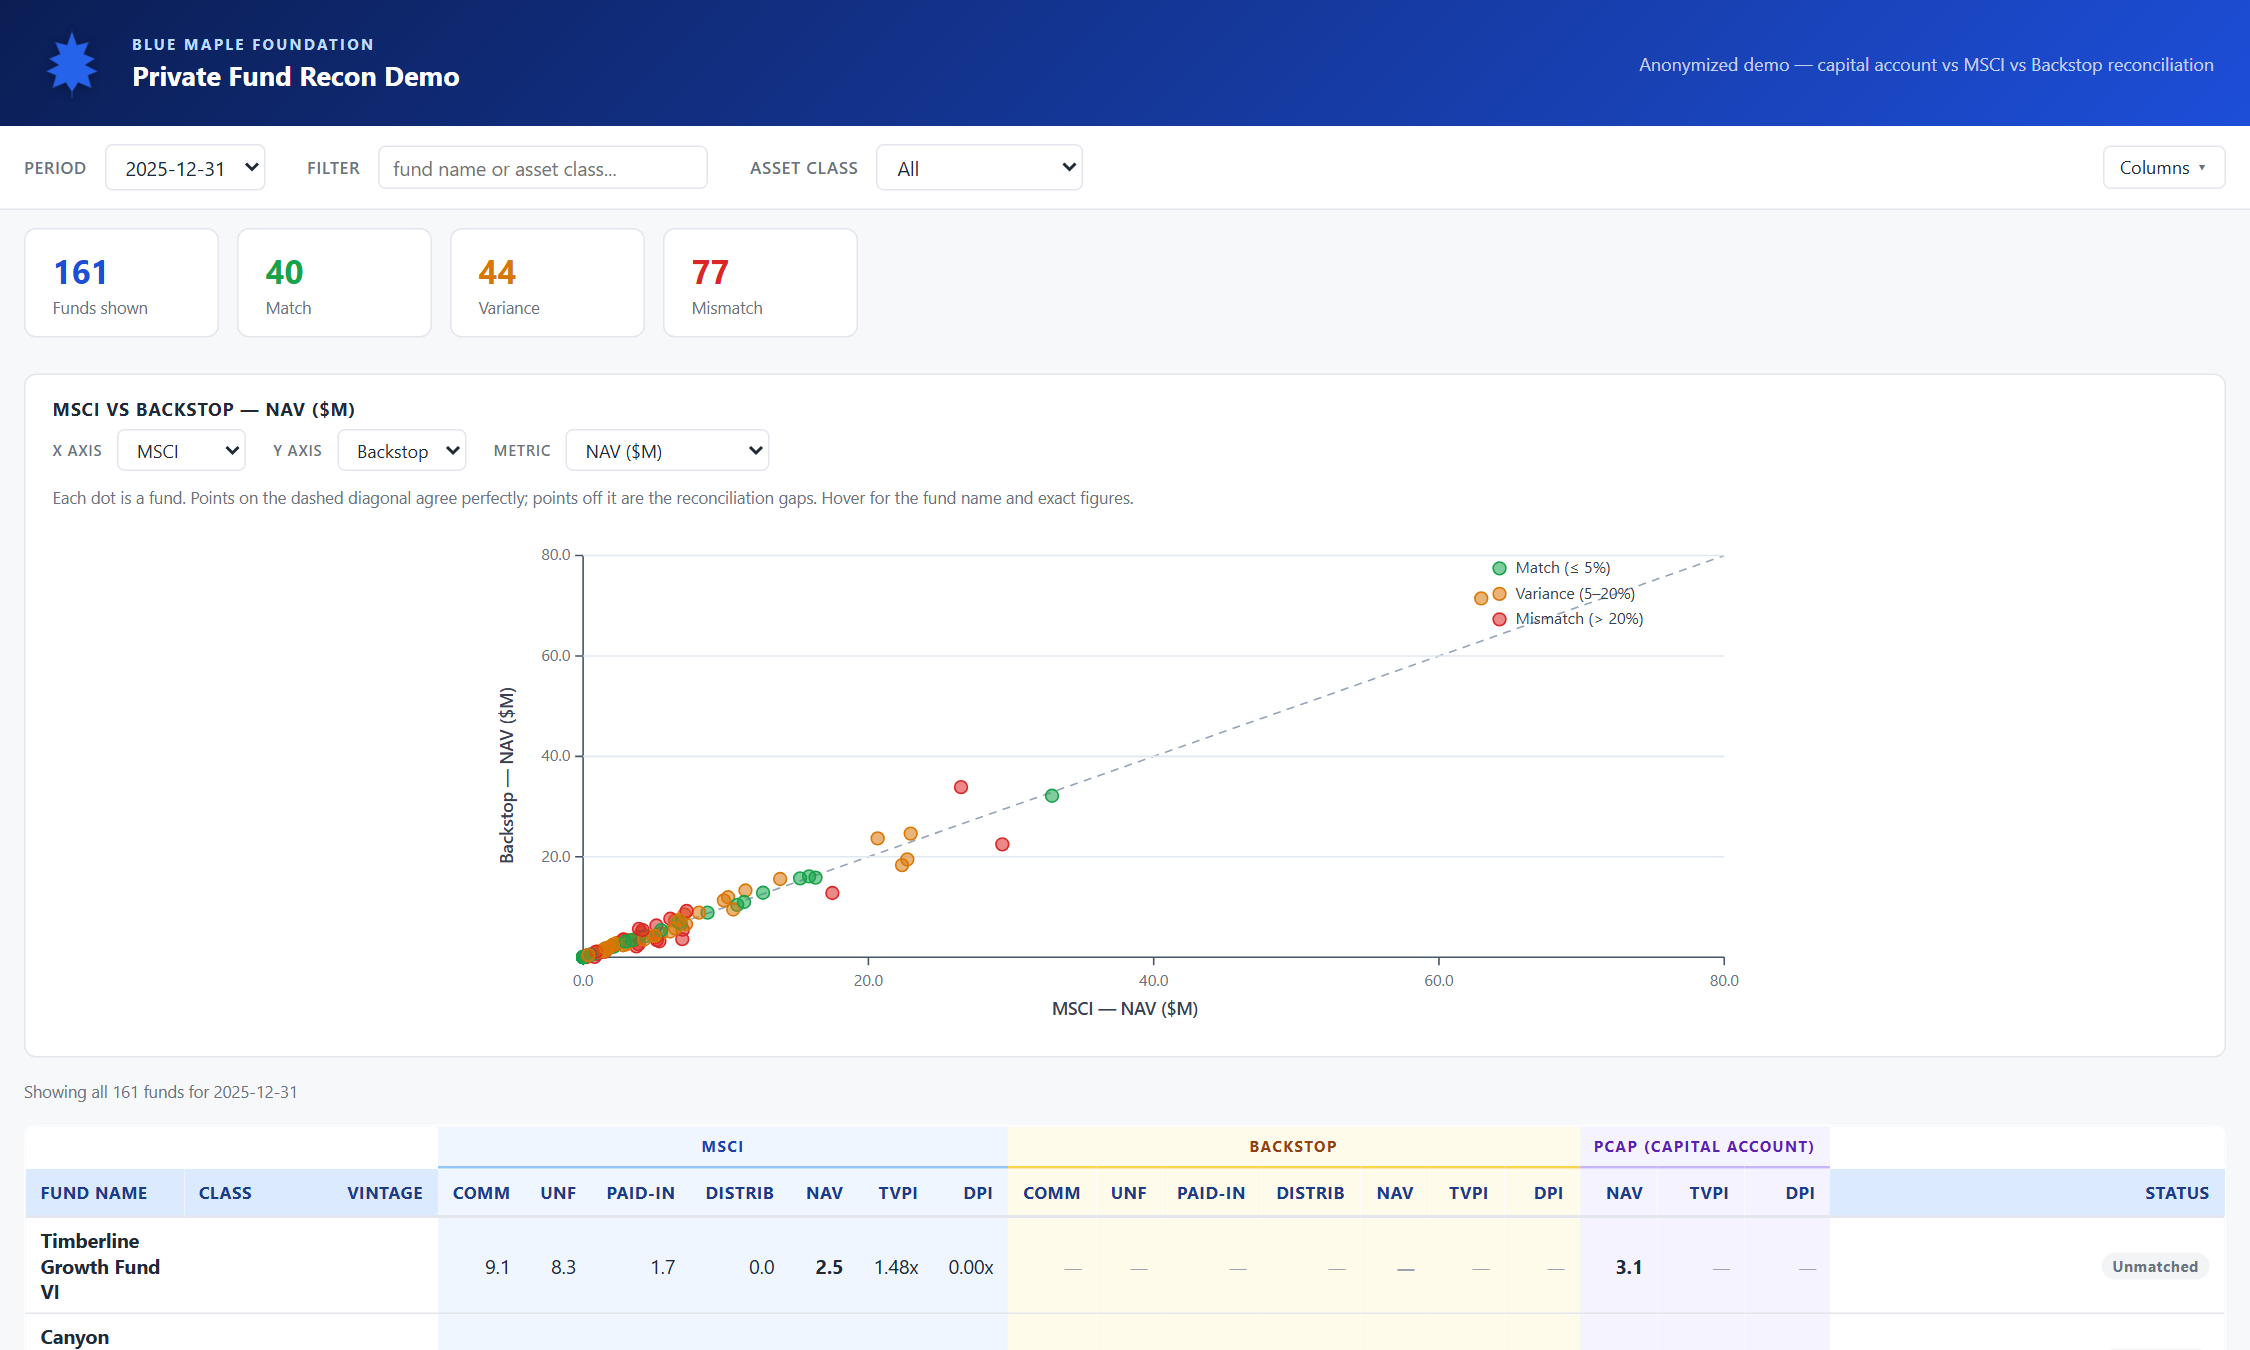
Read the scatter plot
X axis defaults to MSCI NAV ($M), Y axis to Backstop NAV ($M). The dashed line is y = x — any dot on it means the two systems agree perfectly. Dots are colour-coded by match status. Hover any dot to see the fund's name and exact MSCI and Backstop NAV.
Switch the metric
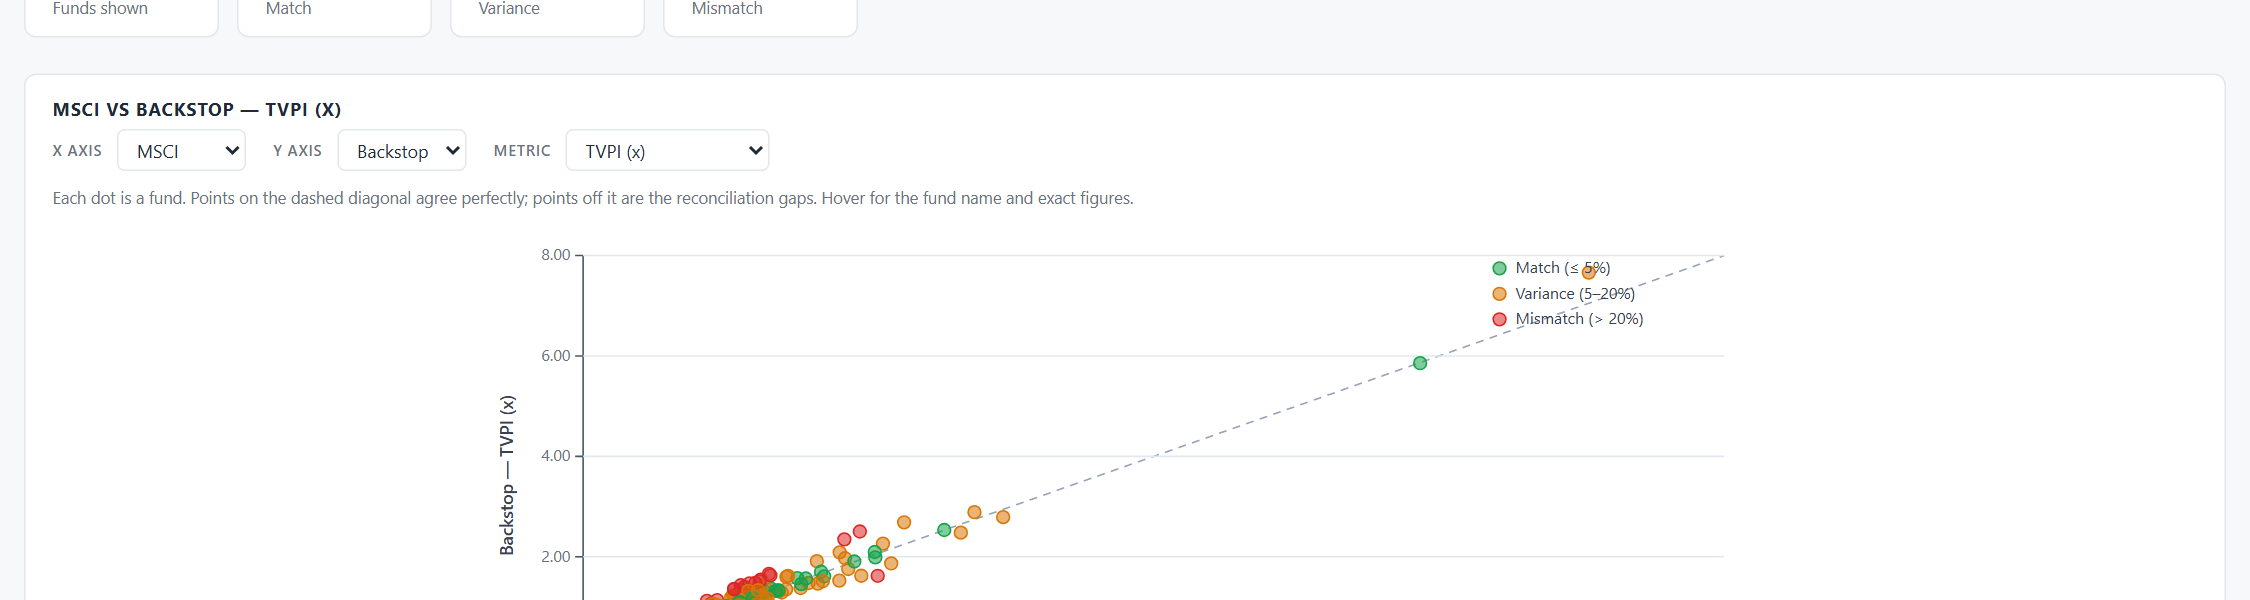
Use the Metric dropdown above the scatter. NAV is the default; you can also pick Commitment, Unfunded, Paid-in, Distributions, TVPI, or DPI. The axes auto-relabel and switch between $M (for cash metrics) and x-multiples (for TVPI/DPI).
Compare different system pairs
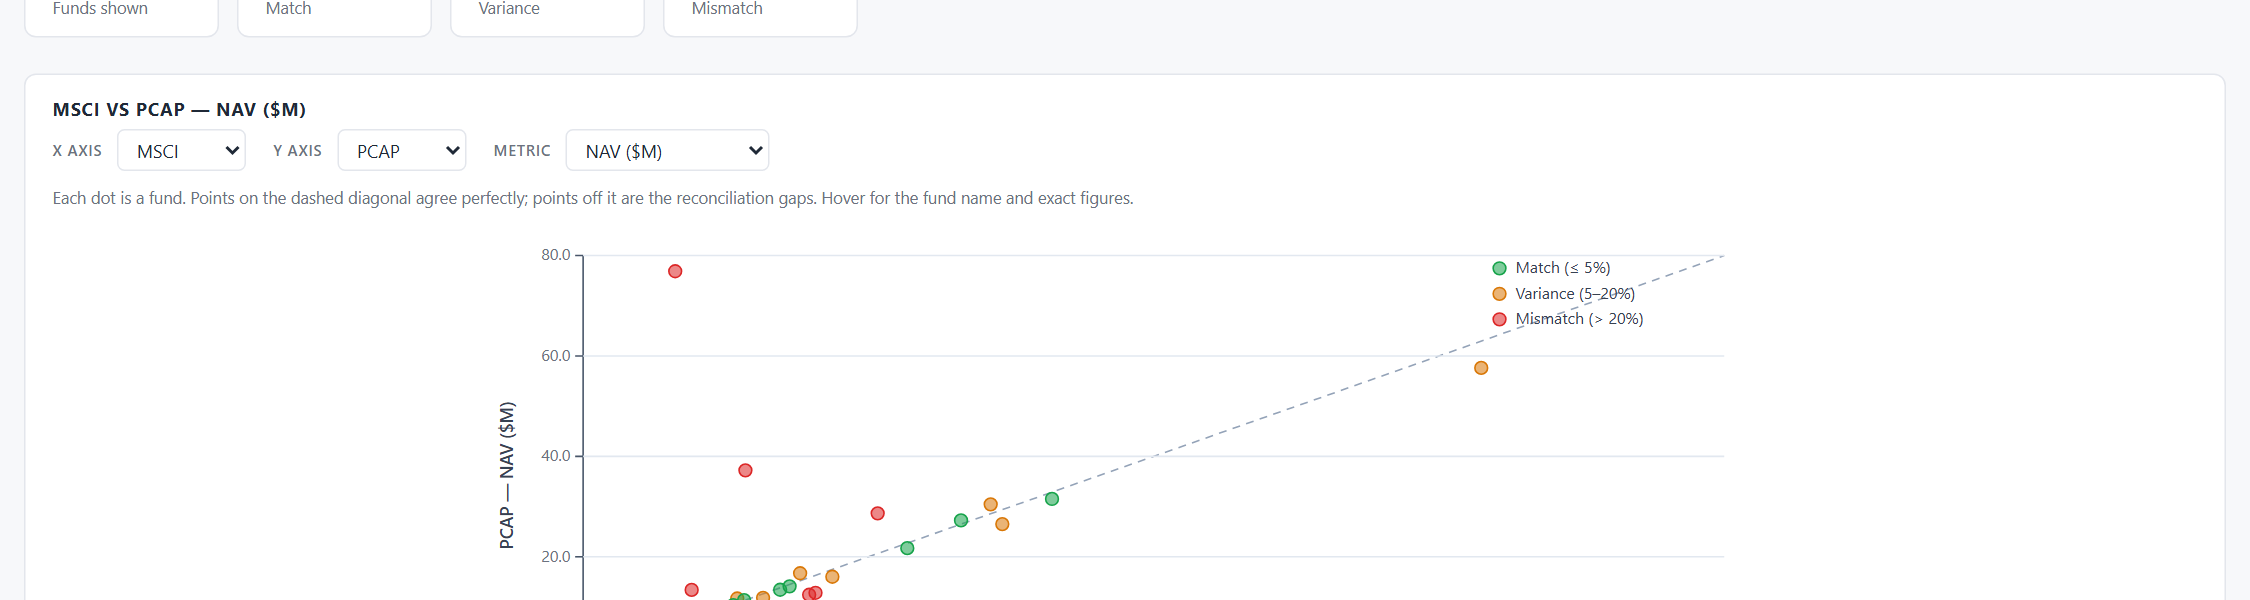
Change the X or Y dropdown to compare any two systems. MSCI vs PCAP highlights where the analytics platform disagrees with the manager's own statement; Backstop vs PCAP highlights back-office data-entry differences.
Browse the full table
Below the scatter, every fund has its own row. Three super-headers group the columns: MSCI (blue), Backstop (amber), PCAP (violet). Inside each group: Commitment, Unfunded, Paid-in, Distributions, NAV, TVPI, DPI — 7 metric columns per system.
Open the column visibility picker
Top-right of the toolbar, click the Columns dropdown. A panel appears with every column grouped by system. PCAP commitment, unfunded, paid-in, and distributions are hidden by default (because the source data is sparse for those fields). Uncheck any column to hide it; group super-headers auto-update.
Resize columns to taste
Drag the right edge of any column header. The cursor turns into a resize handle. Double-click to reset to auto width. Useful when fund names get long.
Filter by period & asset class
Pick a different period from the leftmost dropdown to see prior quarters. Pick an asset class (Buyout, Growth, etc.) to scope the table to one strategy. The scatter and summary cards re-render in sync.
Search by fund name
Type into the Filter box to scope by fund name (or asset class substring). Useful for finding a single fund quickly when you have 160 to choose from.

Read the summary cards
The four cards at the top tell you the state of the recon at a glance: how many funds are shown after filters, how many match, how many have variance (5–20%), how many mismatch (> 20%). Cards re-count on every filter change.
